Published online Jan 28, 2011. doi: 10.3748/wjg.v17.i4.470
Revised: November 25, 2010
Accepted: December 2, 2010
Published online: January 28, 2011
AIM: To explore the expression pattern of E2F5 in primary hepatocellular carcinomas (HCCs) and elucidate the roles of E2F5 in hepatocarcinogenesis.
METHODS: E2F5 expression was analyzed in 120 primary HCCs and 29 normal liver tissues by immunohistochemistry analysis. E2F5-small interfering RNA was transfected into HepG2, an E2F5-overexpressed HCC cell line. After E2F5 knockdown, cell growth capacity and migrating potential were examined.
RESULTS: E2F5 was significantly overexpressed in primary HCCs compared with normal liver tissues (P = 0.008). The E2F5-silenced cells showed significantly reduced proliferation (P = 0.004). On the colony formation and soft agar assays, the number of colonies was significantly reduced in E2F5-silenced cells (P = 0.004 and P = 0.009, respectively). E2F5 knockdown resulted in the accumulation of G0/G1 phase cells and a reduction of S phase cells. The number of migrating/invading cells was also reduced after E2F5 knockdown (P = 0.021).
CONCLUSION: To our knowledge, this is the first evidence that E2F5 is commonly overexpressed in primary HCC and that E2F5 knockdown significantly repressed the growth of HCC cells.
- Citation: Jiang Y, Yim SH, Xu HD, Jung SH, Yang SY, Hu HJ, Jung CK, Chung YJ. A potential oncogenic role of the commonly observed E2F5 overexpression in hepatocellular carcinoma. World J Gastroenterol 2011; 17(4): 470-477
- URL: https://www.wjgnet.com/1007-9327/full/v17/i4/470.htm
- DOI: https://dx.doi.org/10.3748/wjg.v17.i4.470
Hepatocellular carcinoma (HCC) is the fifth most common cancer and the third leading cause of cancer death worldwide[1]. More than half a million cases are newly diagnosed every year, and a similar number of patients die each year. Given that the overall incidence of HCC is still rising and the prognosis remains poor, it is important to develop effective diagnostic and therapeutic modalities based on the biological knowledge of hepatocarcinogenesis[2,3].
Our group previously explored the profiles of chromosomal alterations in primary HCC by performing a genome-wide, microarray-based, comparative genomic hybridization analysis and found that the 8q21.2 locus harboring the E2F5 gene was recurrently amplified in HCC[4]. E2F5 is a member of the E2F transcription factor family that binds to the promoters of the target genes involved in cell cycle control and that consequently regulates the expression of these target genes[5]. The E2F family, located in the downstream of the growth factor signaling cascades, plays a central role in cell growth and proliferation through regulating the genes involved in cell cycle progression[6]. Therefore, it is possible for the members of the E2F family to become involved in oncogenesis. The members of the E2F family are divided into activator (E2F1-E2F3) and repressor (E2F4-E2F8) subclasses[5]. Overexpression of the E2F activators has been reported to induce uncontrolled proliferation of cells in diverse human cancers such as breast, ovarian, lung and gastrointestinal cancers[7-10]. Although the E2F repressors are expected to behave as tumor suppressors, a substantial amount of evidence instead indicates the possibility that some E2F repressors may have oncogenic effects in tumorigenesis[5].
The overexpression or amplification of the E2F5 gene has been reported in various solid tumors such as breast, colon, ovarian cancers and osteogenic sarcoma[11-17]. When the E2F5 gene was co-transfected with DP-1 and Ras into rat kidney cells, the number of transformed foci increased[11]. However, there has been no report on the expression profile of E2F5 in human HCC and its biological roles in hepatocarcinogenesis.
In this study, we explored the expression profiles of E2F5 in primary human HCC and its biological effects by performing knockdown of the E2F5 using specific small interfering RNA (siRNA) in a human HCC cell line.
For screening E2F5 expression in primary HCC, HCC tissue microarrays were prepared. Formalin-fixed, paraffin-embedded tissue blocks from 120 HCC patients were identified from the archives of the Department of Hospital Pathology under the approval of the Institutional Review Board of the Catholic University of Korea, College of Medicine (CUMC06U014). Tissue microarrays were constructed using a manual tissue arrayer (Quick-Ray Manual Tissue Microarrayer, Unitma Co., Ltd., Seoul, Korea). Hematoxylin-eosin stained sections from each sample were examined and then tumor cell-rich areas were selected for use in tissue microarrays. A microarray consisting of 29 samples of normal liver tissue was also constructed. The tissue array paraffin block was then cut into 5-μm paraffin sections for immunohistochemistry (IHC) analysis.
HepG2 was obtained from ATCC (Manassas, VA, USA) and maintained in DMEM (Gibco BLR, Gaithersburg, MD, USA) supplemented with 10% FBS at 37°C containing 5% CO2. As controls, THLE-2 and THLE-3 (human normal liver epithelial cell lines) were purchased from ATCC (Manassas, VA, USA) and maintained in DMEM supplemented with 10% FBS and 25 mmol/L HEPES.
E2F5 immunostaining was performed using tissue microarray slides. Briefly, the tissue sections were deparaffinized and quenched with 3% hydrogen peroxide for 10 min. Antigen retrieval was then conducted using 0.01 mol/L citrate buffer (pH 6.0) by heating the sample in a microwave vacuum histoprocessor (RHS-1, Milestone, Bergamo, Italy) at a controlled final temperature of 121°C for 15 min. The monoclonal mouse anti-E2F5 antibody (220D1a, Abcam, Cambridge, UK) was then diluted 1:50 in Dako Antibody Diluent (Dako, Carpinteria, CA, USA) with background-reducing components, after which it was incubated overnight at 4°C and then detected using the Envision plus System (Dako, Carpinteria, CA, USA). The immunoreaction was developed by treating the samples with diaminobenzidine (Dako, Carpinteria, CA, USA) for 5 min, and hematoxylin counterstaining was applied.
Total RNA was isolated from the cells using the TRIzol reagent (Invitrogen, Carlsbad, CA, USA). Reverse transcription was performed using oligo-(dT) primer and SuperScript III reverse transcriptase (Invitrogen, Carlsbad, CA, USA). Quantitative reverse transcriptase polymerase chain reaction (qRT-PCR) was performed with a mixture containing cDNA, 1 × SYBR Green Tbr polymerase mixture (FINNZYMES, Espoo, Finland), 0.5 × ROX, and primers using Mx3000P QPCR (Stratagene, La Jolla, CA, USA). The thermal cycling included one cycle at 95°C for 10 min, followed by 45 cycles of 95°C at 10 s, 55°C for 30 s and 72°C for 30 s. Relative quantification was performed by the ΔΔCt method as described elsewhere[4]. E2F5 specific primers for qRT-PCR were as follows; 5'-TCAGGACCTATCCATGTGCTGCTT-3' for forward and 5'-TCAGAGACATGTTGCTCAGGCAGA-3' for reverse. The GAPDH gene was used as an internal control and its specific primers were as follows; 5'-GCGGGGCTCTCCAGAACATCAT-3' for forward and 5'-CCAGCCCCAGCGTCAAAGGTG-3' for reverse.
Three types of E2F5-specific siRNAs were purchased (Invitrogen, Carlsbad, CA, USA), whose sequences were as follows: UUAUAAGCAGCACAUGGAUAGGUCCGGACCUAUCCAUGUGCUGCUUAUAA for siE2F5-1; AAUUAAAGUUGUAGUCAUCUGCCGGCCGGCAGAUGACUACAACUUUAAUU for siE2F5-2; AUGAUAUCUCCACUAAUAGAUCCUGCAGGAUCUAUUAGUGGAGAUAUCAU for siE2F5-3. The siE2F5-1, -2, and -3 target exons were 6, 7 and 8, respectively. To estimate the sequence-specific effectiveness of the E2F5 siRNAs, we used a negative control siRNA (siNEG) (Invitrogen, Carlsbad, CA, USA) that has no significant homology with any known sequences in the human genome. In total, 100 nmol/L of each siRNA was transfected onto 6 × 10⁵ HepG2 cells in a 100 mm culture dish using lipofectamine RNAiMAX according to the manufacturer’s instructions (Invitrogen, Carlsbad, CA, USA). Forty-eight hours following the transfection, the cells were harvested and E2F5 expression was measured by qRT-PCR and Western blotting.
Transfected cells were harvested and lysed in cell lysis buffer (50 mmol/L NaF, 150 mmol/L NaCl, 10 mmol/L sodium pyrophosphate, 2 mmol/L EDTA, 0.1% Triton X-100) with protease inhibitor. The resulting cellular proteins (30 μg per lane) were electrophoresed in a 10% SDS-polyacrylamide gel and separated proteins were transferred to a PVDF membrane (Millipore, Bedford, MA, USA). Membranes were blocked with 5% non-fat dried milk in TBST (20 mmol/L Tris-HCl, 150 mmol/L NaCl, and 0.1% Tween 20, pH 7.5), and then incubated overnight with anti-E2F5 (Abcam, Cambridge, UK) and anti α-tubulin antibodies (Sigma, St. Louis, MI, USA) at 4°C according to the manufacturer’s instructions. After washing with TBST, the PVDF membrane was incubated with diluted HRP-conjugated anti-rabbit IgG for 1 h at room temperature. The blots were detected using an enhanced chemiluminescence system (Amersham-Pharmacia Biotech, Braunschweig, Germany). The expression of α-tubulin was used as a control.
Growth of HepG2 cells was determined using the cell proliferation reagent WST-1 (Roche, Indianapolis, IN, USA) according to the manufacturer’s protocol. Optical density was read at 450 nm at various time points. Three independent experiments were carried out.
Invasion of HepG2 cells was assayed using the 24-well format transwell chambers (Becton Dickinson Labware, Franklin Dickinson, NJ, USA) of 8 μm-pore size. siRNA transfected cells were added onto the Matrigel (BD Biosciences, San Jose, CA, USA) coated filters in 200 μL of serum-free RPMI1640 (2 × 10⁴ cells/filter). In the lower chambers, 500 μL of RPMI1640 media containing 10% FBS was added. After 20-h incubation at 37°C in the 5% CO2 incubator, cells were stained with 0.5% crystal violet in 20% methanol and then examined under the microscope. Cells on the top surface of the membrane were removed by wiping with a cotton swab. The numbers of cells were counted in five microscopic fields (× 40). The migration assay was carried out in the same manner but using filters without Matrigel coating. Two independent experiments were performed for each assay.
Forty-eight hours after transfection with siRNA, 1 × 10⁴ HepG2 cells were seeded in 100-mm culture dishes. Two weeks later, cultured cells were stained with 0.5% crystal violet and the number of colonies was counted. Three independent experiments were carried out for each assay.
To explore the effect of E2F5 on anchorage independent growth of HepG2 cells, a soft agar assay was performed. HepG2 cells were suspended in RPMI1640 containing 0.35% low melting agarose, and plated onto solidified 0.6% agarose containing RPMI1640 in six-well culture plates at a density of 1 × 10⁵ cells per dish. After incubating for 2 wk at 37°C in the 5% CO2 incubator, the number of colonies was counted. Two independent experiments were carried out for each assay.
Forty-eight hours after transfection with siRNA, the adherent cells were detached by trypsin treatment, washed twice with PBS, and then exposed to 70% ethanol on ice for 2 h. After washing, cells were incubated with 5 mg/mL propidium iodide and 50 mg/mL RNase-A in PBS for 15 min at 37°C. A flow activated cell sorter (FACS) analysis was carried out using a FACS Calibur flow cytometer (Becton Dickson, Mountain View, CA, USA) with CELLQUEST software. A total of 10 000 events were measured per run.
The statistical analysis was performed using the SPSS statistical software (SPSS Inc., Chicago, IL, USA). Statistical significance was determined by the Mann-Whitney test for continuous variables and by the χ2 or Fisher’s exact test for categorical variables. P values less than 0.05 were considered statistically significant.
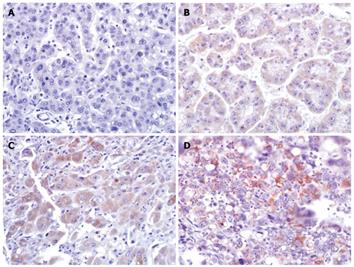
We examined the E2F5 protein expression level in the 120 primary HCCs and 29 normal liver tissues by tissue microarray-based IHC. E2F5 expression was mostly localized in the cytoplasm with occasional nuclear staining. Cytoplasmic staining was considered a positive result. We graded the E2F5 staining intensity from 0 (negative) to 3 (strongly positive) (Figure 1A-D). E2F5 expression was absent in all the normal liver tissues tested, while positive in 22 (18.3%) of 120 HCCs (P = 0.008); 17 cases of grade 1, 4 cases of grade 2, and one case of grade 3. Although E2F5 intensities showed a trend of positive correlation with tumor grades, it was not statistically significant (data not shown).
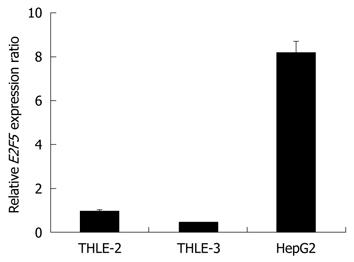
To assess the biological effects of E2F5 overexpression in hepatocarcinogenesis, we used E2F5 gene specific siRNA to disrupt its expression in the HepG2 liver cancer cell line. Before knockdown, we assessed the expression level of E2F5 in the HepG2 cells by qRT-PCR and confirmed that the E2F5 expression was up-regulated more than 8-fold compared with that of the normal liver cells (Figure 2). Before transfection, we optimized the amount of lipofectamine to ensure the maximal transfection efficiency and minimal cellular toxicity (data not shown). Then we introduced three E2F5 gene specific siRNA constructs (siE2F5-1, -2, and -3) and siNEG into the HepG2 cells. The effect of each siRNA on the E2F5 expression level was examined by qRT-PCR and Western blotting analysis. Of the three siRNAs examined, siE2F5-1 and siE2F5-3 were shown to efficiently repress the RNA expression level (approximately 90% reduction) by qRT-PCR (Figure 3A). In the Western blotting analysis, both siE2F5-1 and siE2F5-3 also efficiently repressed the E2F5 expression, but the latter was slightly better than the former (Figure 3B). Therefore, all the downstream functional analyses were performed using siE2F5-3 (hereafter called siE2F5).
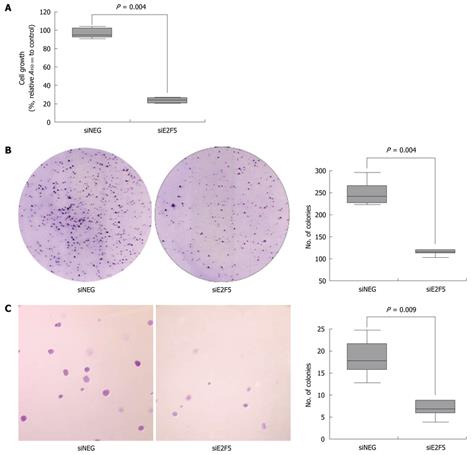
To explore the effect of E2F5 on HCC cell growth, we performed proliferation and colony formation assays. In the proliferation assay, the siE2F5 transfected cells showed reduced proliferation compared with that of the siNEG transfected cells by over 75% (P = 0.004, Figure 4A). In the colony formation assay, the number of colonies from the siE2F5 treated cells [median 119, interquartile range (IQR) 116-124] was significantly smaller than that from the siNEG treated cells (median 243, IQR 228-267, P = 0.004) (Figure 4B). Next, we examined the E2F5 knockdown effect on the anchorage independent growth of HCC cells using the soft agar assay. The number of anchorage-independent colonies of the siE2F5 treated cells (median 7, IQR 6-9) was significantly reduced as compared with that of the siNEG treated cells (median 18, IQR 16-22, P = 0.009) (Figure 4C).
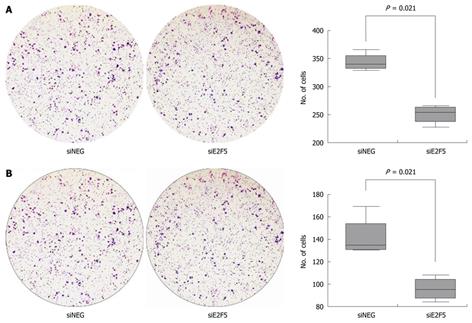
The number of migrating cells was significantly reduced by E2F5 knockdown (median 339.5, IQR 331.5-354.5 in the siNEG treated cells vs median 253.5, IQR 236.5-263, P = 0.021). The number of invading cells was also significantly reduced (median 134.5, IQR 130.5-153.5 vs median 95, IQR 87-104, P = 0.021) (Figure 5).
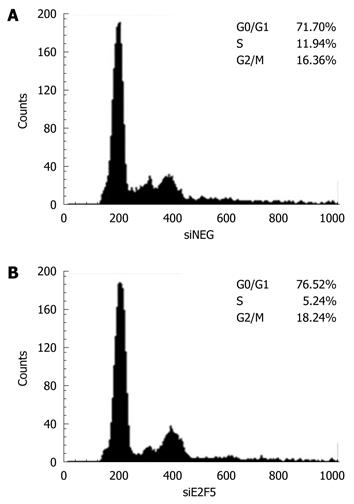
To explore the mechanisms behind the anti-proliferative effect in the siE2F5 transfected cells, we observed the cell cycle profile of the HepG2 cells by performing FACS analysis after siE2F5 transfection. E2F5 knockdown resulted in the accumulation of G0/G1 phase cells and the reduction of S phase cells compared with that of the siNEG tranfected cells. The proportion of G1-phase cells in the siE2F5 treated cells was 76.5%, while it was 71.7% in the siNEG treated cells. In contrast, the proportion of S phase cells in the siE2F5 treated cells (5.2%) was much lower than that in the siNEG treated cells (11.9%) (Figure 6).
Amplification of the E2F5 gene has been frequently observed in diverse human cancers[11,12,16]. We previously reported that the 8q21.2 locus, which harbors the E2F5 gene, was recurrently amplified in primary human HCC[4]. These data suggest the oncogenic potential of E2F5 amplification. However, the E2F repressors (E2F4-E2F8) among the E2F family members have been reported to show paradoxical behaviors in tumorigenesis[5]. In Rb+/-E2f4-/- mice, E2f4 loss suppressed the development of pituitary and thyroid tumors, which suggested its oncogenic role in these tissues[18]. This phenomenon was also observed in Rb-/-E2f4-/- chimeric mice, where E2F4 loss delayed the development and reduced the incidence of pituitary tumors[19]. However, the same Rb-/-E2f4-/- chimeras developed ganglionic neuroendocrine neoplasms and urothelial transitional carcinomas, which indicates a tumor suppressive role for E2F repressors[19]. In 3T3 mouse fibroblasts, artificially overexpressed E2F4 and E2F5 inhibited malignant transformation, while overexpressed E2F2 and E2F3a showed an oncogenic capacity[20]. Thus, E2F repressors may play an oncogenic or tumor suppressor role in a tissue specific manner[5].
In this study, we explored the biological consequences of E2F5 overexpression in hepatocarcinogenesis and the involved molecular mechanisms. To begin with, we examined the expression of E2F5 protein in 120 primary HCCs and 29 normal liver tissues by tissue microarray based IHC and found that 18.3% of HCCs were positive, while none of the normal liver tissues were positive (P = 0.008). Although there has been no report on E2F5 overexpression in HCC, E2F5 overexpression has been reported in ovarian and breast cancers[11-15]. E2F5 overexpression was observed in both early and advanced stage ovarian cancer, and this suggested the potential involvement of E2F5 in the pathogenesis of ovarian cancer[13,15]. In breast cancer, E2F5 overexpression was also significantly associated with an ER/PR/HER2 triple negative status and with a worse clinical outcome[12]. In this study, we did not find a significant correlation between tumor grade and E2F5 expression, but the correlation cannot be excluded because the sample size may not have been large enough. Associations between E2F5 expression and other phenotypes were not able to be assessed due to the limited clinical information of the primary HCC used in this study.
We knocked down the E2F5 expression using E2F5 gene specific siRNA transfection to explore the biological effects of E2F5 overexpression in hepatocarcinogenesis. We found that E2F5 knockdown profoundly repressed the growth of HCC cells compared with the untransfected cells. The repression of HepG2 cell growth after E2F5 knockdown was simultaneously observed in the proliferation, colony formation and soft agar assays. These data can be related to the results of Polanowska et al[11], where the amplification and subsequent overexpression of the E2F5 gene promoted cell transformation together with other oncogenes in human breast tumors. Our results as well as the previous observations suggested the involvement of E2F5 gene amplification and overexpression in the tumorigenesis of various cancers including HCC.
It is widely recognized that the E2F family, including E2F5, is involved in tumorigenic processes through deregulation of cell cycle progression[5,21]. In order to understand the nature of the siE2F5-mediated growth inhibition, we analyzed the cell cycle of the HCC cell line by FACS analysis after E2F5 knockdown. Consistent with our prediction, treatment with siE2F5 seemed to arrest the cell cycle at the G0/Gl phase. In a previous study with human WI38 fibroblasts, the E2F5 mRNA expression was maximal in the mid-G1 phase before the E2F1 expression was detectable, which suggests the contribution of E2F5 to the regulation of early G1 events, including the G0/Gl transition[22]. The extent of cell cycle arrest was relatively small considering the prominent growth suppression induced by knockdown of E2F5 in this study. This may indicate the existence of additional effects of unknown factors added to E2F5 overexpression in HCC tumorigenesis. Migration and invasion capacities of HepG2 cells were also significantly inhibited by E2F5 knockdown. However, we did not explore whether E2F5 was directly involved in the migration- or invasion-related pathways or if the inhibitory effect was due to repression of HepG2 cell proliferation. Further functional studies are required to fully understand the oncogenic roles of E2F5 in HCC. The E2F5-interacting molecules also need to be identified to properly understand the behaviors of HCC.
To our knowledge, this is the first evidence that E2F5 is commonly overexpressed in primary human HCC and that E2F5 knockdown profoundly repressed the growth of HCC cells. The overexpression of E2F5 may induce uncontrollable cell cycle progression in liver cells and eventually contribute to cancer transformation by working together with other carcinogenic factors. This study will help to understand hepatocarcinogenesis mechanisms and to define therapeutic targets of early HCC.
Although the incidence of hepatocellular carcinoma (HCC) is still high and the prognosis remains poor, the molecular mechanisms of HCC are largely unknown. To develop effective diagnostic and therapeutic modalities, it is important to understand the mechanisms underlying hepatocarcinogenesis.
E2F5 is a member of the E2F transcription factor family, and plays a key role in cell growth and proliferation. Overexpression of E2F5 has been reported in various human cancers, but not in liver cancer, and its biological implication is largely unknown. In this study, the authors investigated the expression profile of E2F5 in primary HCCs and explored the biological effects of E2F5 overexpression by knockdown of the gene.
This is the first evidence that E2F5 is relatively overexpressed in primary human HCC. Knockdown of E2F5 expression suppressed growth, invasion, and migration of HCC cell lines. Overexpression of E2F5 has been found to induce uncontrollable cell cycle progression, which may contribute to hepatocarcinogenesis.
Repressed proliferation of E2F5 silenced cells suggests that blocking this molecule could be used to decrease the growth of cancer cells in HCC patients. Expression of E2F5 can also be used as a diagnostic or prognostic marker in HCC.
This is an interesting experimental study regarding the potential role of the transcription factor E2F5 in hepatocarcinogenesis.
Peer reviewer: Dr. Anna Chiara Piscaglia, MD, Specialist in Gastroenterology and Digestive Endoscopy, GI and Liver Stem Cell Research Group (GILSteR), Department of Internal Medicine - Digestive Endoscopy Unit, Gemelli Hospital - Catholic University of Rome, Largo A. Gemelli, 8 - 00168 Rome, Italy
S- Editor Tian L L- Editor Webster JR E- Editor Zheng XM
| 1. | Parkin DM, Bray F, Ferlay J, Pisani P. Global cancer statistics, 2002. CA Cancer J Clin. 2005;55:74-108. [Cited in This Article: ] |
| 2. | El-Serag HB. Hepatocellular carcinoma: recent trends in the United States. Gastroenterology. 2004;127:S27-S34. [Cited in This Article: ] |
| 3. | Llovet JM, Burroughs A, Bruix J. Hepatocellular carcinoma. Lancet. 2003;362:1907-1917. [Cited in This Article: ] |
| 4. | Kim TM, Yim SH, Shin SH, Xu HD, Jung YC, Park CK, Choi JY, Park WS, Kwon MS, Fiegler H. Clinical implication of recurrent copy number alterations in hepatocellular carcinoma and putative oncogenes in recurrent gains on 1q. Int J Cancer. 2008;123:2808-2815. [Cited in This Article: ] |
| 5. | Chen HZ, Tsai SY, Leone G. Emerging roles of E2Fs in cancer: an exit from cell cycle control. Nat Rev Cancer. 2009;9:785-797. [Cited in This Article: ] |
| 6. | Ren B, Cam H, Takahashi Y, Volkert T, Terragni J, Young RA, Dynlacht BD. E2F integrates cell cycle progression with DNA repair, replication, and G(2)/M checkpoints. Genes Dev. 2002;16:245-256. [Cited in This Article: ] |
| 7. | Han S, Park K, Bae BN, Kim KH, Kim HJ, Kim YD, Kim HY. E2F1 expression is related with the poor survival of lymph node-positive breast cancer patients treated with fluorouracil, doxorubicin and cyclophosphamide. Breast Cancer Res Treat. 2003;82:11-16. [Cited in This Article: ] |
| 8. | Reimer D, Sadr S, Wiedemair A, Stadlmann S, Concin N, Hofstetter G, Müller-Holzner E, Marth C, Zeimet AG. Clinical relevance of E2F family members in ovarian cancer--an evaluation in a training set of 77 patients. Clin Cancer Res. 2007;13:144-151. [Cited in This Article: ] |
| 9. | Eymin B, Gazzeri S, Brambilla C, Brambilla E. Distinct pattern of E2F1 expression in human lung tumours: E2F1 is upregulated in small cell lung carcinoma. Oncogene. 2001;20:1678-1687. [Cited in This Article: ] |
| 10. | Lee J, Park CK, Park JO, Lim T, Park YS, Lim HY, Lee I, Sohn TS, Noh JH, Heo JS. Impact of E2F-1 expression on clinical outcome of gastric adenocarcinoma patients with adjuvant chemoradiation therapy. Clin Cancer Res. 2008;14:82-88. [Cited in This Article: ] |
| 11. | Polanowska J, Le Cam L, Orsetti B, Vallés H, Fabbrizio E, Fajas L, Taviaux S, Theillet C, Sardet C. Human E2F5 gene is oncogenic in primary rodent cells and is amplified in human breast tumors. Genes Chromosomes Cancer. 2000;28:126-130. [Cited in This Article: ] |
| 12. | Umemura S, Shirane M, Takekoshi S, Kusakabe T, Itoh J, Egashira N, Tokuda Y, Mori K, Osamura YR. Overexpression of E2F-5 correlates with a pathological basal phenotype and a worse clinical outcome. Br J Cancer. 2009;100:764-771. [Cited in This Article: ] |
| 13. | Shridhar V, Lee J, Pandita A, Iturria S, Avula R, Staub J, Morrissey M, Calhoun E, Sen A, Kalli K. Genetic analysis of early- versus late-stage ovarian tumors. Cancer Res. 2001;61:5895-5904. [Cited in This Article: ] |
| 14. | Sawiris GP, Sherman-Baust CA, Becker KG, Cheadle C, Teichberg D, Morin PJ. Development of a highly specialized cDNA array for the study and diagnosis of epithelial ovarian cancer. Cancer Res. 2002;62:2923-2928. [Cited in This Article: ] |
| 15. | Kothandaraman N, Bajic VB, Brendan PN, Huak CY, Keow PB, Razvi K, Salto-Tellez M, Choolani M. E2F5 status significantly improves malignancy diagnosis of epithelial ovarian cancer. BMC Cancer. 2010;10:64. [Cited in This Article: ] |
| 16. | Lassmann S, Weis R, Makowiec F, Roth J, Danciu M, Hopt U, Werner M. Array CGH identifies distinct DNA copy number profiles of oncogenes and tumor suppressor genes in chromosomal- and microsatellite-unstable sporadic colorectal carcinomas. J Mol Med. 2007;85:293-304. [Cited in This Article: ] |
| 17. | Fuchs B, Zhang K, Schabel A, Bolander ME, Sarkar G. Identification of twenty-two candidate markers for human osteogenic sarcoma. Gene. 2001;278:245-252. [Cited in This Article: ] |
| 18. | Lee EY, Cam H, Ziebold U, Rayman JB, Lees JA, Dynlacht BD. E2F4 loss suppresses tumorigenesis in Rb mutant mice. Cancer Cell. 2002;2:463-472. [Cited in This Article: ] |
| 19. | Parisi T, Bronson RT, Lees JA. Inhibition of pituitary tumors in Rb mutant chimeras through E2f4 loss reveals a key suppressive role for the pRB/E2F pathway in urothelium and ganglionic carcinogenesis. Oncogene. 2009;28:500-508. [Cited in This Article: ] |
| 20. | Chen C, Wells AD. Comparative analysis of E2F family member oncogenic activity. PLoS One. 2007;2:e912. [Cited in This Article: ] |
| 21. | Gaubatz S, Lindeman GJ, Ishida S, Jakoi L, Nevins JR, Livingston DM, Rempel RE. E2F4 and E2F5 play an essential role in pocket protein-mediated G1 control. Mol Cell. 2000;6:729-735. [Cited in This Article: ] |
| 22. | Sardet C, Vidal M, Cobrinik D, Geng Y, Onufryk C, Chen A, Weinberg RA. E2F-4 and E2F-5, two members of the E2F family, are expressed in the early phases of the cell cycle. Proc Natl Acad Sci USA. 1995;92:2403-2407. [Cited in This Article: ] |


