Copyright
©2011 Baishideng Publishing Group Co.
World J Gastroenterol. Jan 28, 2011; 17(4): 470-477
Published online Jan 28, 2011. doi: 10.3748/wjg.v17.i4.470
Published online Jan 28, 2011. doi: 10.3748/wjg.v17.i4.470
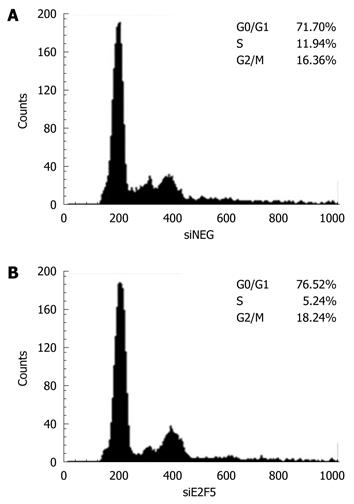
Figure 6 Effect of siE2F5 treatment on HepG2 cell cycle progression.
After siE2F5 transfection into the HepG2 cells, cell cycle profile was examined by flow cytometry analysis. DNA histogram shows the accumulation of G0/G1-phase cells in siE2F5 transfected HepG2 cells compared with the siNEG transfected cells.
- Citation: Jiang Y, Yim SH, Xu HD, Jung SH, Yang SY, Hu HJ, Jung CK, Chung YJ. A potential oncogenic role of the commonly observed E2F5 overexpression in hepatocellular carcinoma. World J Gastroenterol 2011; 17(4): 470-477
- URL: https://www.wjgnet.com/1007-9327/full/v17/i4/470.htm
- DOI: https://dx.doi.org/10.3748/wjg.v17.i4.470


