Copyright
©2011 Baishideng Publishing Group Co.
World J Gastroenterol. Jan 21, 2011; 17(3): 313-321
Published online Jan 21, 2011. doi: 10.3748/wjg.v17.i3.313
Published online Jan 21, 2011. doi: 10.3748/wjg.v17.i3.313
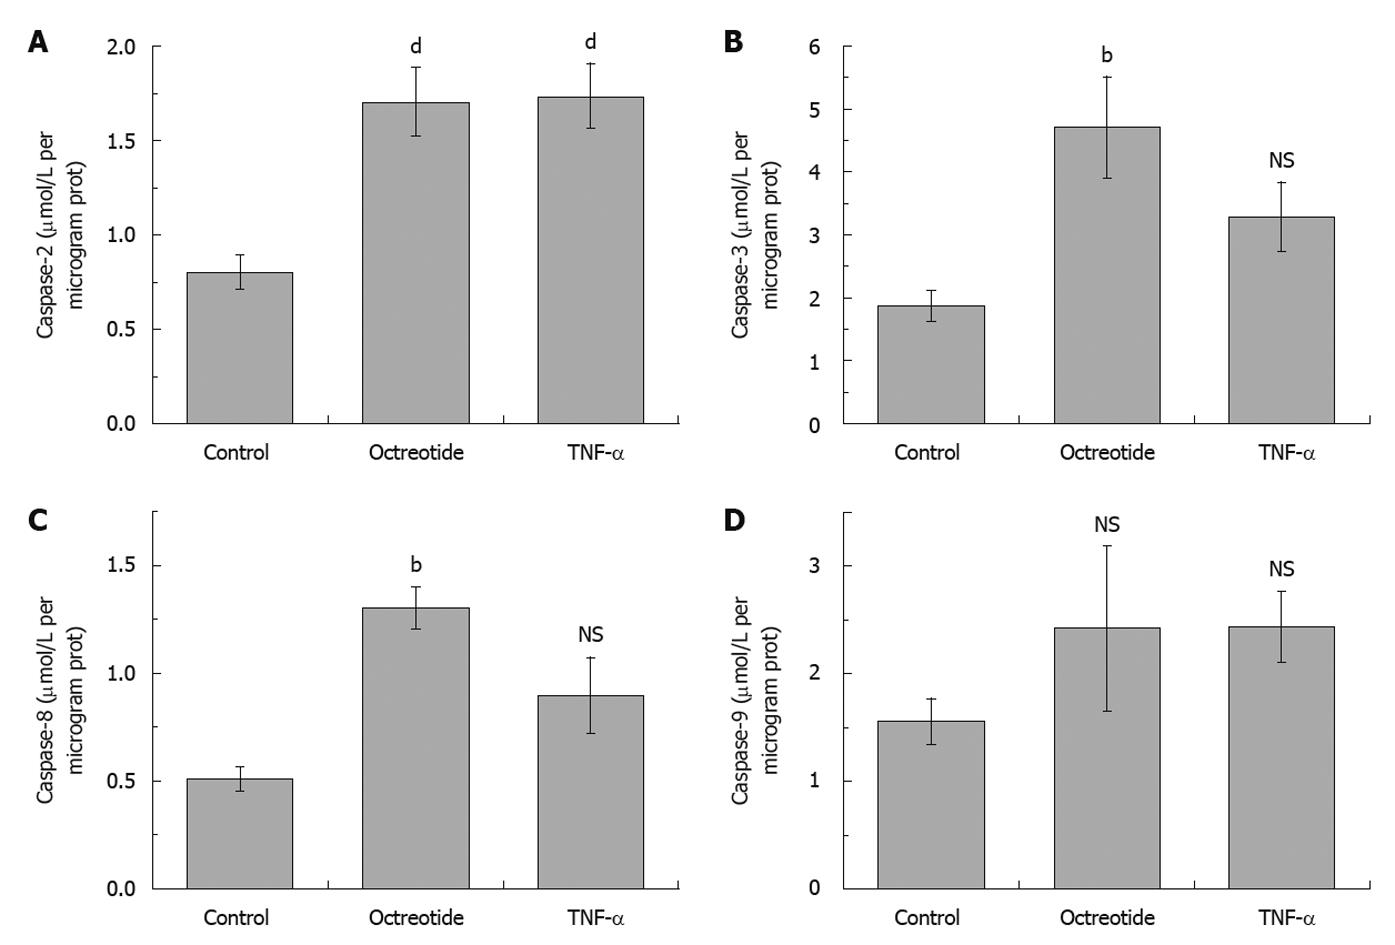
Figure 5 Caspase-2 (A), -3 (B), -8 (C) and -9 (D) activities, after treatment of HepG2 cells with 10-8 mol/L octreotide and 20 ng/mL tumor necrosis factor-α, compared to untreated cells.
The results represent the mean of 10 different experiments ± SE (bP < 0.01, dP < 0.001). TNF-α: Tumor necrosis factor-α; NS: Not significant.
- Citation: Tsagarakis NJ, Drygiannakis I, Batistakis AG, Kolios G, Kouroumalis EA. Octreotide induces caspase activation and apoptosis in human hepatoma HepG2 cells. World J Gastroenterol 2011; 17(3): 313-321
- URL: https://www.wjgnet.com/1007-9327/full/v17/i3/313.htm
- DOI: https://dx.doi.org/10.3748/wjg.v17.i3.313


