Copyright
©2010 Baishideng Publishing Group Co.
World J Gastroenterol. Nov 7, 2010; 16(41): 5162-5172
Published online Nov 7, 2010. doi: 10.3748/wjg.v16.i41.5162
Published online Nov 7, 2010. doi: 10.3748/wjg.v16.i41.5162
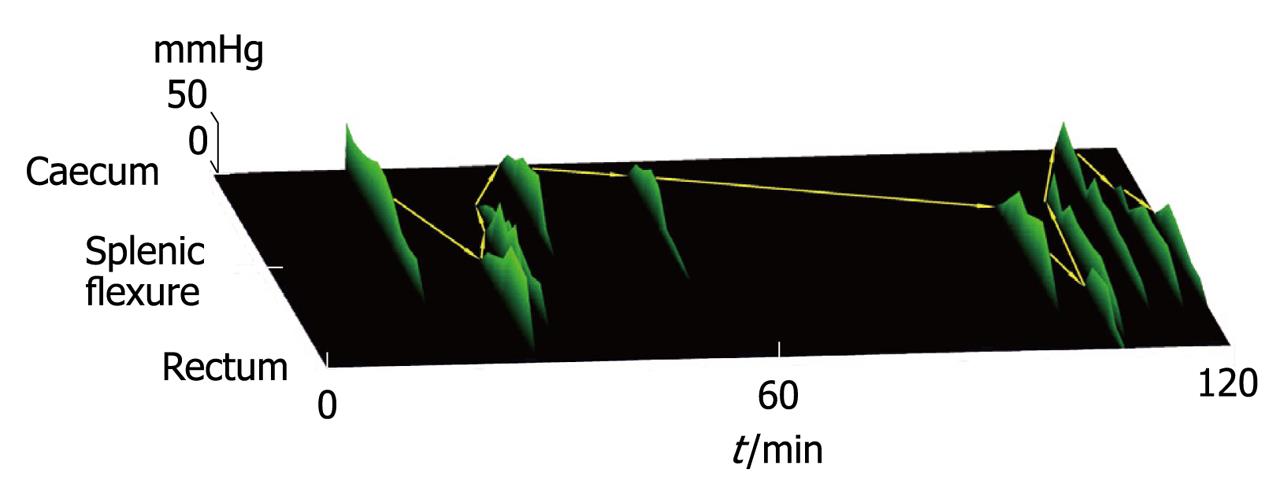
Figure 3 Two hour spatiotemporal maps of colonic propagating sequences in a female healthy control.
In this map each individual ridge represents an antegrade propagating sequence. The start of each ridge indicates the site of origin and the time of day the propagating sequence occurred. The length of the ridge indicates the extent of propagation. The heights of the ridge indicate the amplitude of the component pressure waves. The yellow arrows link the site of origin of sequential propagating sequences. While no single propagating sequence spans the entire colon collectively, a linked series of propagating sequences can do so[76].
- Citation: Dinning PG, Benninga MA, Southwell BR, Scott SM. Paediatric and adult colonic manometry: A tool to help unravel the pathophysiology of constipation. World J Gastroenterol 2010; 16(41): 5162-5172
- URL: https://www.wjgnet.com/1007-9327/full/v16/i41/5162.htm
- DOI: https://dx.doi.org/10.3748/wjg.v16.i41.5162


