Copyright
©2010 Baishideng.
World J Gastroenterol. Jun 21, 2010; 16(23): 2918-2925
Published online Jun 21, 2010. doi: 10.3748/wjg.v16.i23.2918
Published online Jun 21, 2010. doi: 10.3748/wjg.v16.i23.2918
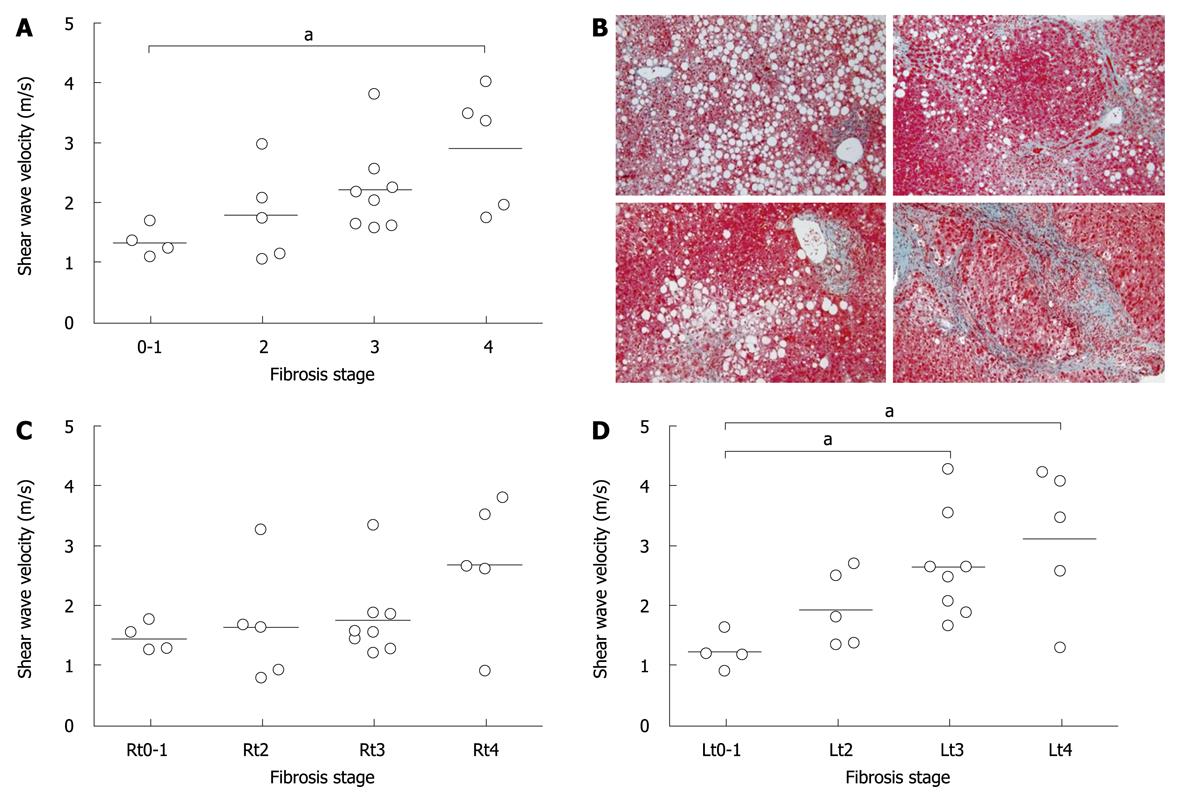
Figure 2 Average shear wave velocity (SWV) and representative photomicrographs in each fibrosis stage.
SWV was measured in four segments; right anterior, right posterior, left medial and left lateral segments, and the average was calculated based on data from four segments (A) or from either one of right [Rt, (C)] or left [Lt, (D)] lobes. Histological fibrosis stages were judged along with Brunt criterion. Each horizontal bar indicates an average SWV. aP < 0.05. The photomicrographs (B) are representative Masson’s trichrome stains for fibrosis stages 1, 2, 3 and 4 from upper left, lower left, and upper right to lower right panels, respectively. Original magnification is × 100.
- Citation: Osaki A, Kubota T, Suda T, Igarashi M, Nagasaki K, Tsuchiya A, Yano M, Tamura Y, Takamura M, Kawai H, Yamagiwa S, Kikuchi T, Nomoto M, Aoyagi Y. Shear wave velocity is a useful marker for managing nonalcoholic steatohepatitis. World J Gastroenterol 2010; 16(23): 2918-2925
- URL: https://www.wjgnet.com/1007-9327/full/v16/i23/2918.htm
- DOI: https://dx.doi.org/10.3748/wjg.v16.i23.2918


