Copyright
©2010 Baishideng.
World J Gastroenterol. May 7, 2010; 16(17): 2151-2157
Published online May 7, 2010. doi: 10.3748/wjg.v16.i17.2151
Published online May 7, 2010. doi: 10.3748/wjg.v16.i17.2151
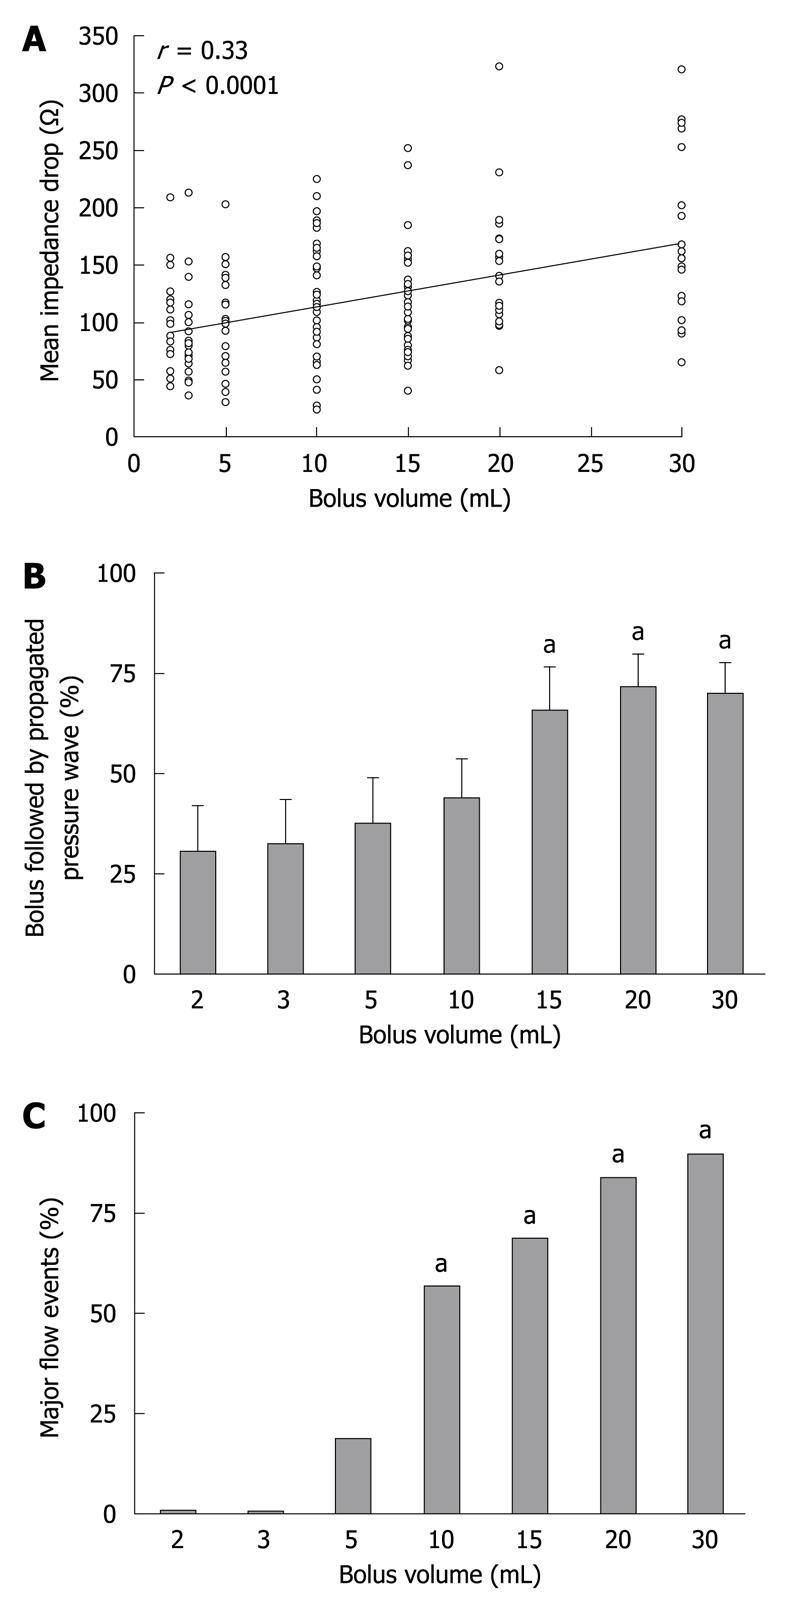
Figure 4 Relationship between bolus volume and the magnitude of impedance drop (A), the proportion of boluses followed by a propagated pressure wave (B) and the occurrence of major flow events (C).
aP < 0.05 vs 2 mL boluses.
- Citation: Nguyen NQ, Bryant LK, Burgstad CM, Fraser RJ, Sifrim D, Holloway RH. Impact of bolus volume on small intestinal intra-luminal impedance in healthy subjects. World J Gastroenterol 2010; 16(17): 2151-2157
- URL: https://www.wjgnet.com/1007-9327/full/v16/i17/2151.htm
- DOI: https://dx.doi.org/10.3748/wjg.v16.i17.2151


