Copyright
©2009 The WJG Press and Baishideng.
World J Gastroenterol. Dec 21, 2009; 15(47): 5936-5945
Published online Dec 21, 2009. doi: 10.3748/wjg.15.5936
Published online Dec 21, 2009. doi: 10.3748/wjg.15.5936
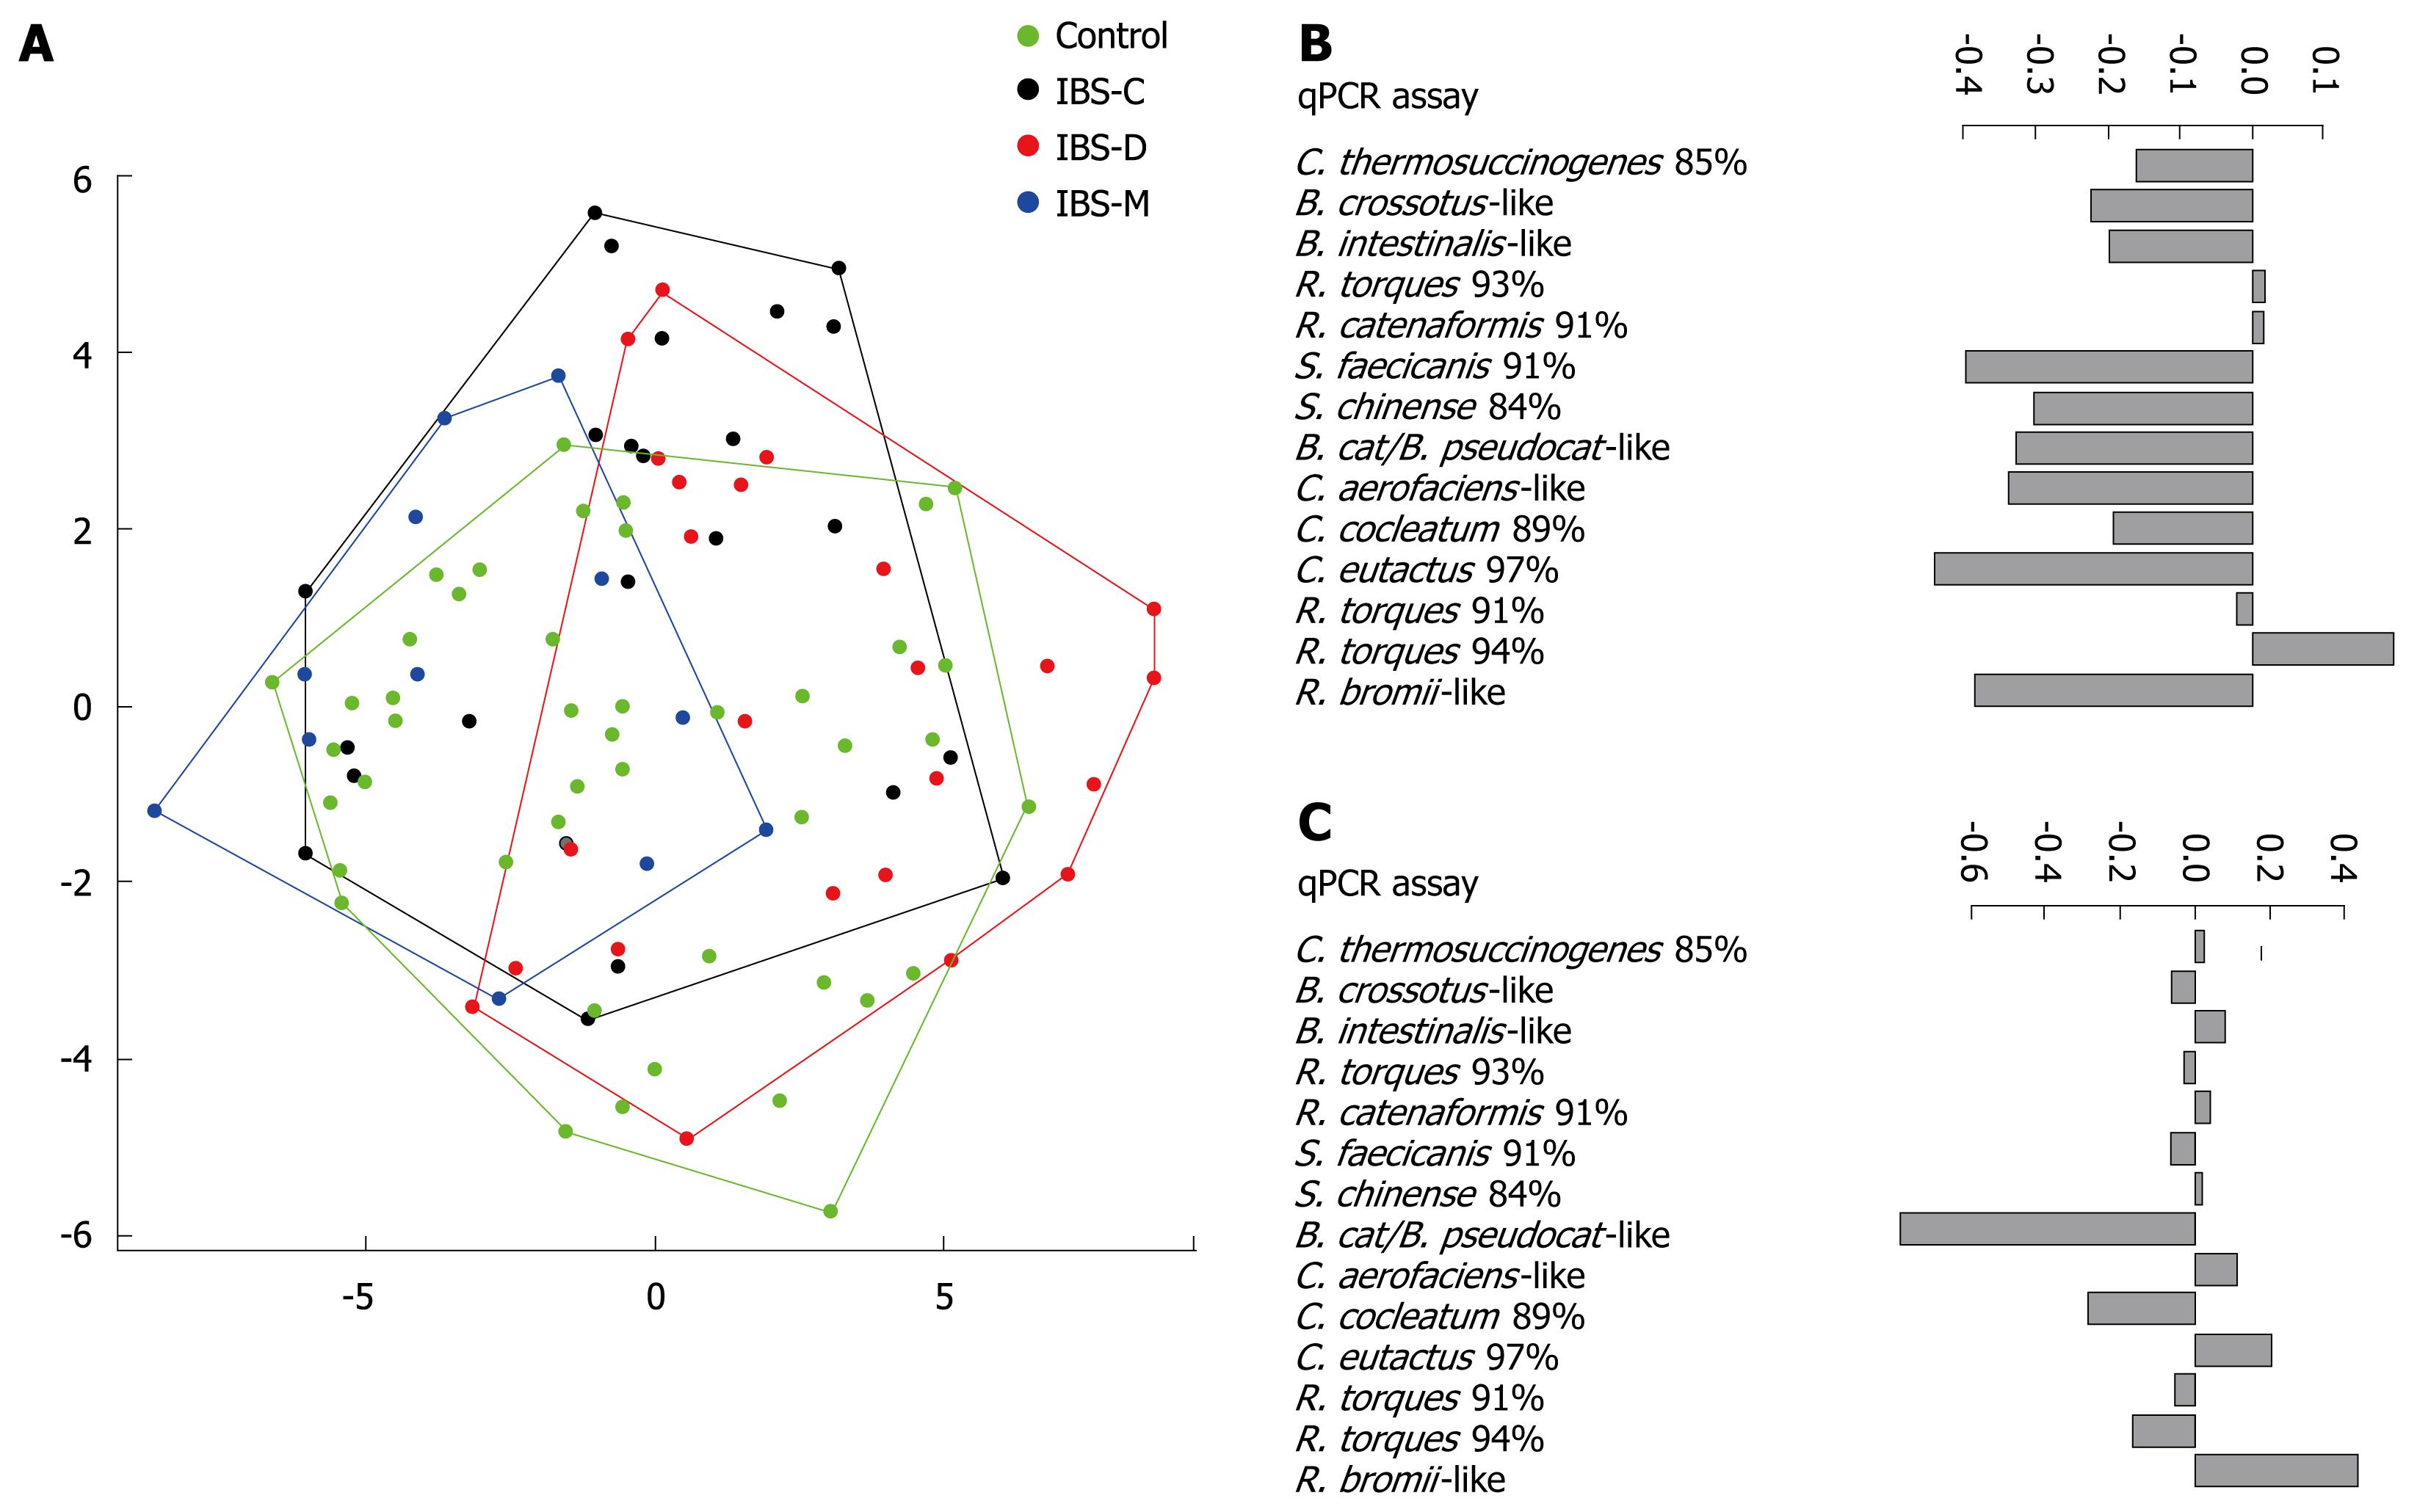
Figure 1 Principal component analysis (PCA) of fourteen 16S rRNA phylotypes quantified from faecal samples of irritable bowel syndrome (IBS) patients and healthy volunteers.
A: The PCA plot with outermost data points within each sample group is outlined. The control samples are presented in green, the constipation-predominant IBS (IBS-C) in black, the diarrhoea-predominant IBS (IBS-D) in red and the mixed symptom-subtype IBS (IBS-M) in blue. Each time-point is presented as a separate point. To quantify the multivariate differences between the groups, linear mixed-effects models were applied to the first (x-axis) and the second (y-axis) principal component scores, which represent the dominant multivariate changes present in the data; B: The bars represent the relative contribution of each quantitative real-time PCR (qPCR) assay to the principal component 1 (PC1). On PC1 the IBS-D samples differed from the control (P≤ 0.01), IBS-M (P≤ 0.01), and IBS-C (P≤ 0.05) samples; C: The bars represent the relative contribution of each qPCR assay to the principal component 2 (PC2). On PC2, the IBS-C patients diverged from the control subjects (P≤ 0.05) and time-points. In addition, the second time-point (3 mo) diverged significantly from the first (0 mo, P≤ 0.01) and the third (6 mo, P≤ 0.01) time-points independent of sample group; The height of the bars in graphs in Figure 1B and C reflect the relative magnitude of the contribution and the direction the sign of the contribution (in relation to the other assays and to the axis in Figure 1A). For example, in PC1 (Figure 1B), the largest contributor is the Coprococcus eutactus 97% phylotype, while the samples on the right in Figure 1A (mostly IBS-D) tend to have higher concentrations of Ruminococcus torques 94% and lower concentrations of phylotypes with bars highly on the negative side. Similarly, on PC2 (Figure 1C) the samples with high PC2 value in the top part of the Figure 1A tend to have higher concentrations of the Ruminococcus bromii-like phylotype, and lower concentrations of the Bifidobacterium catenulatum/Bifidobacterium pseudocatenulatum-like phylotype. On PC2, the IBS-C patients diverged from the control subjects (P≤ 0.05) and time-points. In addition, the second time-point (3 mo) diverged significantly from the first (0 mo, P≤ 0.01) and the third (6 mo, P≤ 0.01) time-points independent of sample group. qPCR: Quantitative real-time polymerase chain reaction; IBS-C: Constipation-predominant irritable bowel syndrome; IBS-D: Diarrhoea-predominant irritable bowel syndrome; IBS-M: Mixed-subtype irritable bowel syndrome.
- Citation: Lyra A, Rinttilä T, Nikkilä J, Krogius-Kurikka L, Kajander K, Malinen E, Mättö J, Mäkelä L, Palva A. Diarrhoea-predominant irritable bowel syndrome distinguishable by 16S rRNA gene phylotype quantification. World J Gastroenterol 2009; 15(47): 5936-5945
- URL: https://www.wjgnet.com/1007-9327/full/v15/i47/5936.htm
- DOI: https://dx.doi.org/10.3748/wjg.15.5936


