Copyright
©2009 The WJG Press and Baishideng.
World J Gastroenterol. Sep 28, 2009; 15(36): 4547-4555
Published online Sep 28, 2009. doi: 10.3748/wjg.15.4547
Published online Sep 28, 2009. doi: 10.3748/wjg.15.4547
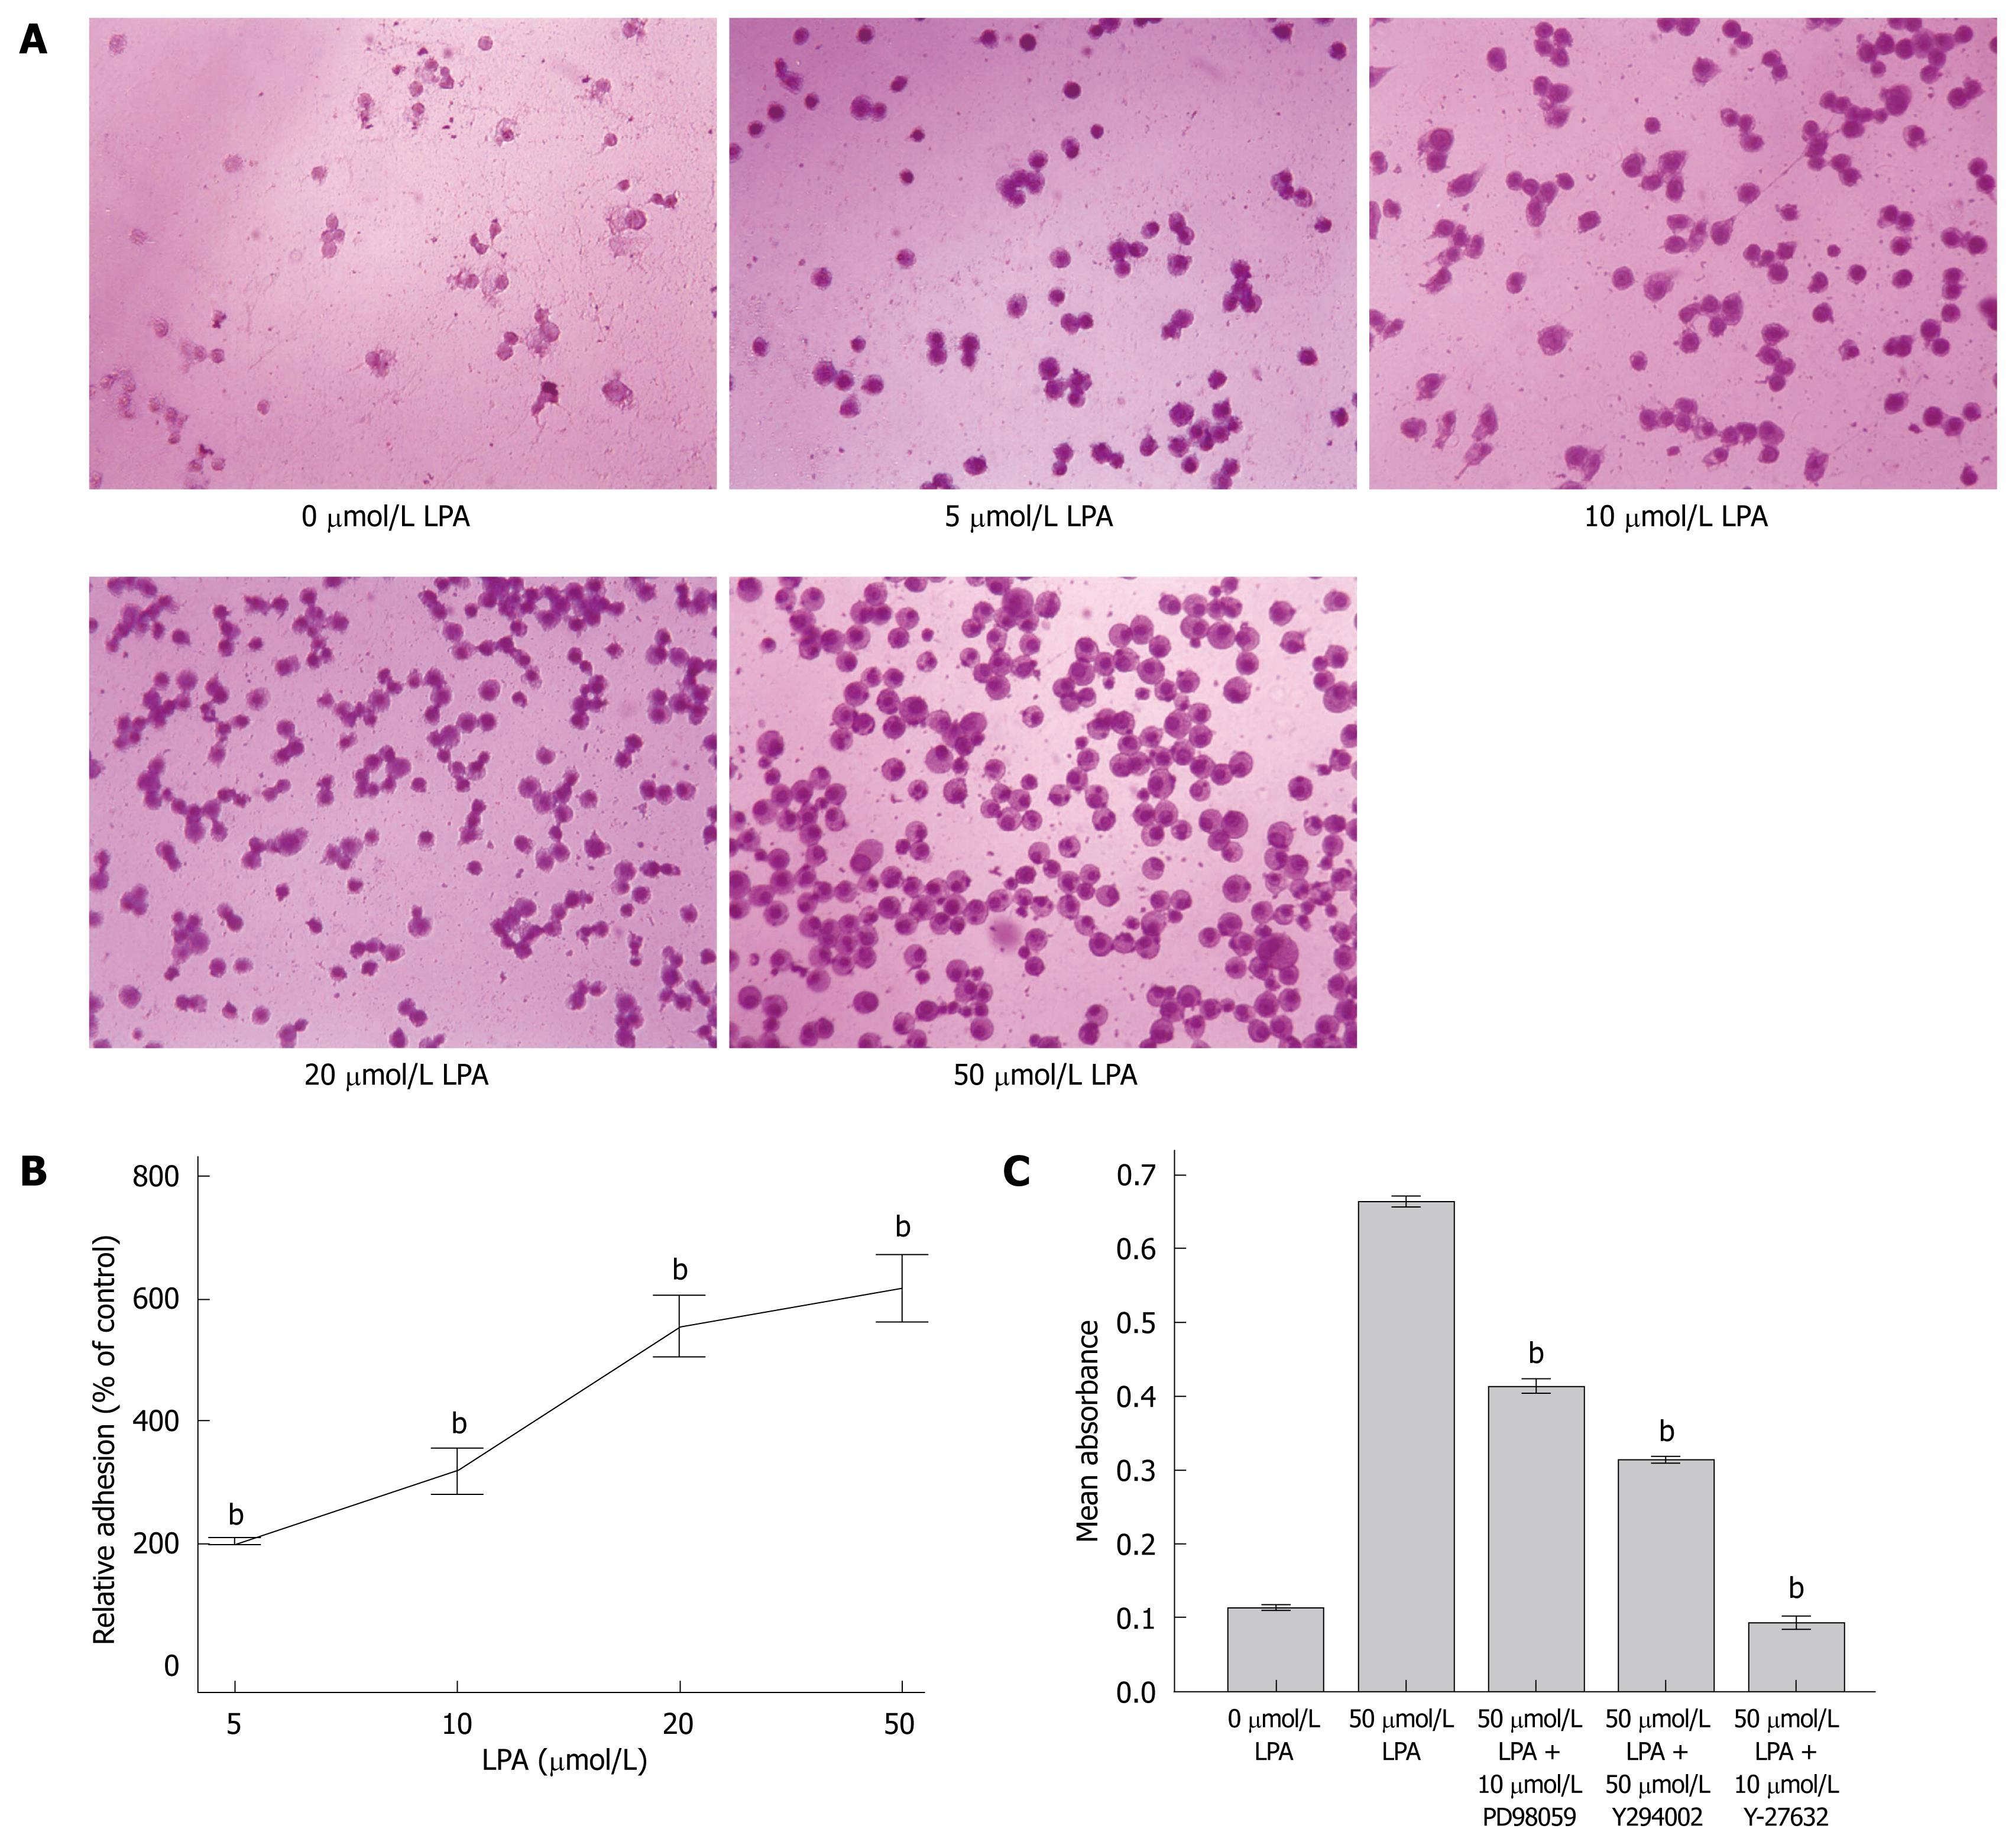
Figure 4 LPA stimulated adhesion of SW480 cells.
A: Typical image of stained adhered cells (× 200); B: Adhered cells were quantified and relative adhesion rates (mean ± SE) are presented. bP < 0.001 vs 0 μmol/L LPA; C: Effect of inhibitors on LPA induced adhesion. 50 μmol/L LPA or LPA plus inhibitors (including 10 μmol/L PD98059, 50 μmol/L LY294002 and 10 μmol/L Y-27632) were added to cells in 96 well plate. Adhered cells were quantified and presented. Results presented as mean ± SE, n = 5. bP < 0.001 vs 50 μmol/L LPA.
- Citation: Sun H, Ren J, Zhu Q, Kong FZ, Wu L, Pan BR. Effects of lysophosphatidic acid on human colon cancer cells and its mechanisms of action. World J Gastroenterol 2009; 15(36): 4547-4555
- URL: https://www.wjgnet.com/1007-9327/full/v15/i36/4547.htm
- DOI: https://dx.doi.org/10.3748/wjg.15.4547


