Copyright
©2009 The WJG Press and Baishideng.
World J Gastroenterol. May 28, 2009; 15(20): 2479-2488
Published online May 28, 2009. doi: 10.3748/wjg.15.2479
Published online May 28, 2009. doi: 10.3748/wjg.15.2479
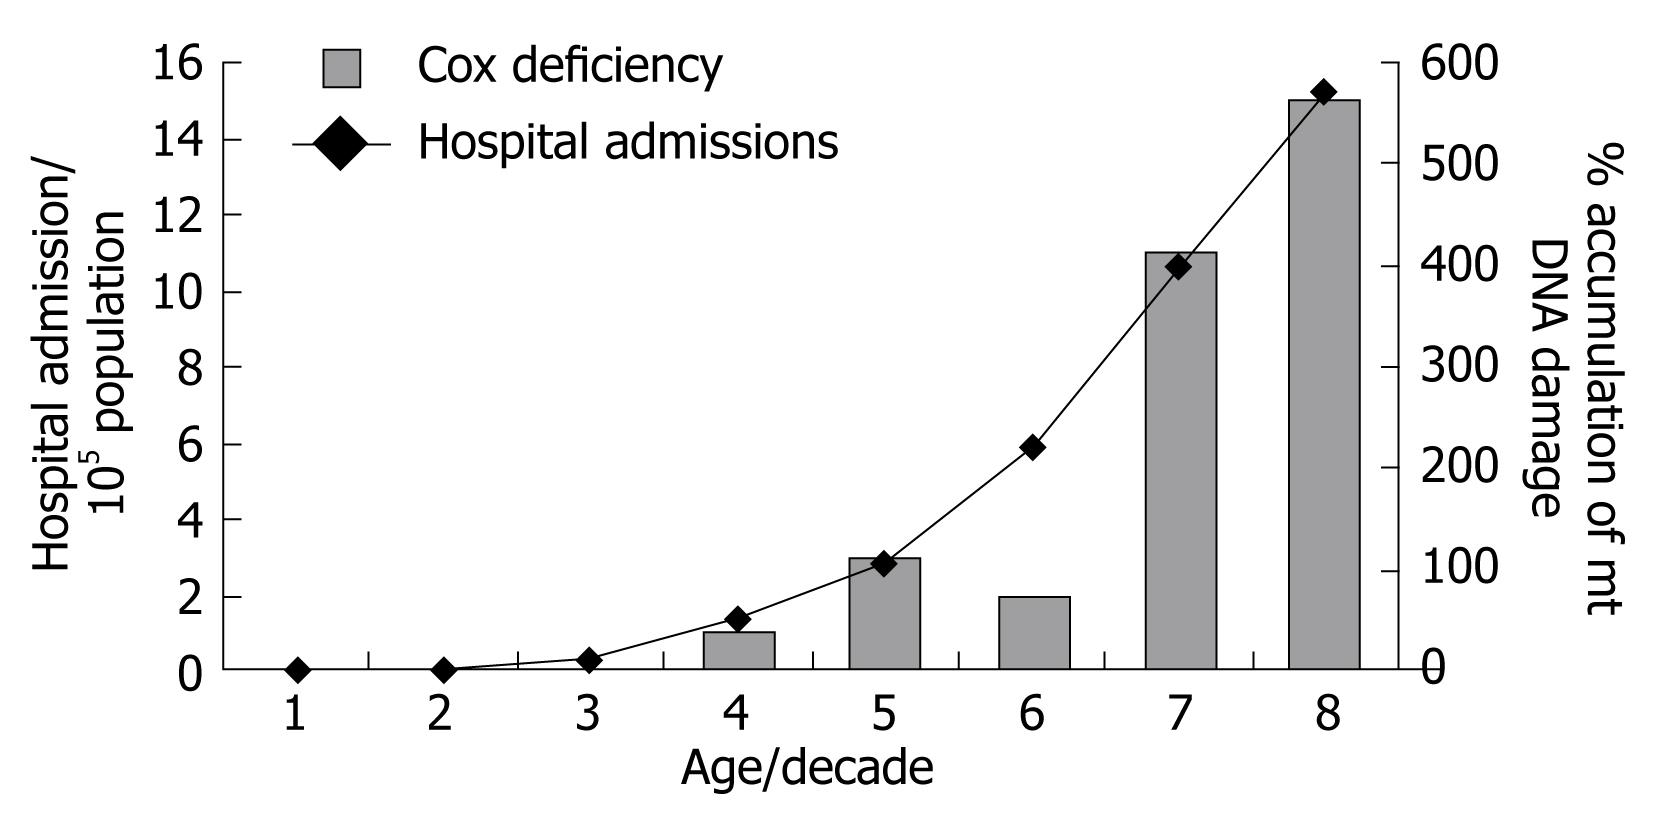
Figure 4 Graph showing the relationship of age with mitochondrial DNA damage and risk of hospital admissions for DD.
Graph showing the correlation between the percentage accumulation mitochondrial (mt) DNA damage in the colonic mucosa - right hand y axis whilst left hand y axis shows hospital admissions for DD/105 in the UK. Ageing is expressed on the x axis in decades. The incidence of asymptomatic disease is considerably higher but the rate of hospital admissions may mirror DD incidence in the population as a whole. Mitochondrial DNA mutations are inferred from level of deficiency/inactivity in the respiratory chain mitochondrial protein Cytochrome C oxidase[102].
- Citation: Commane DM, Arasaradnam RP, Mills S, Mathers JC, Bradburn M. Diet, ageing and genetic factors in the pathogenesis of diverticular disease. World J Gastroenterol 2009; 15(20): 2479-2488
- URL: https://www.wjgnet.com/1007-9327/full/v15/i20/2479.htm
- DOI: https://dx.doi.org/10.3748/wjg.15.2479


