Copyright
©2009 The WJG Press and Baishideng.
World J Gastroenterol. Mar 21, 2009; 15(11): 1289-1300
Published online Mar 21, 2009. doi: 10.3748/wjg.15.1289
Published online Mar 21, 2009. doi: 10.3748/wjg.15.1289
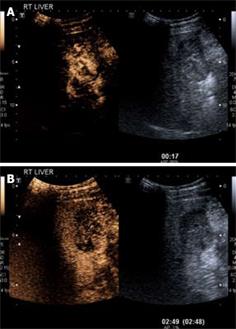
Figure 2 HCC.
A: CEUS in the arterial phase (17 s following injection) demonstrates arterial phase enhancement of the solid lesion (corresponding grey scale image of the lesion is shown on the right hand side; software known as “twin view” which helps the sonologist track the lesion through the phases of enhancement). Note the “basket weave” pattern of angiogenic vessels with haphazard enhancement of this lesion; B: Twin view of the same segment IV lesion in the delayed phase (2 min 49 s following injection) of the same lesion as Figure 2A demonstrates contrast wash-out compared to the surrounding liver parenchyma which are features of a malignant lesion.
- Citation: Ariff B, Lloyd CR, Khan S, Shariff M, Thillainayagam AV, Bansi DS, Khan SA, Taylor-Robinson SD, Lim AK. Imaging of liver cancer. World J Gastroenterol 2009; 15(11): 1289-1300
- URL: https://www.wjgnet.com/1007-9327/full/v15/i11/1289.htm
- DOI: https://dx.doi.org/10.3748/wjg.15.1289


