Copyright
©2008 The WJG Press and Baishideng.
World J Gastroenterol. Jun 21, 2008; 14(23): 3719-3724
Published online Jun 21, 2008. doi: 10.3748/wjg.14.3719
Published online Jun 21, 2008. doi: 10.3748/wjg.14.3719
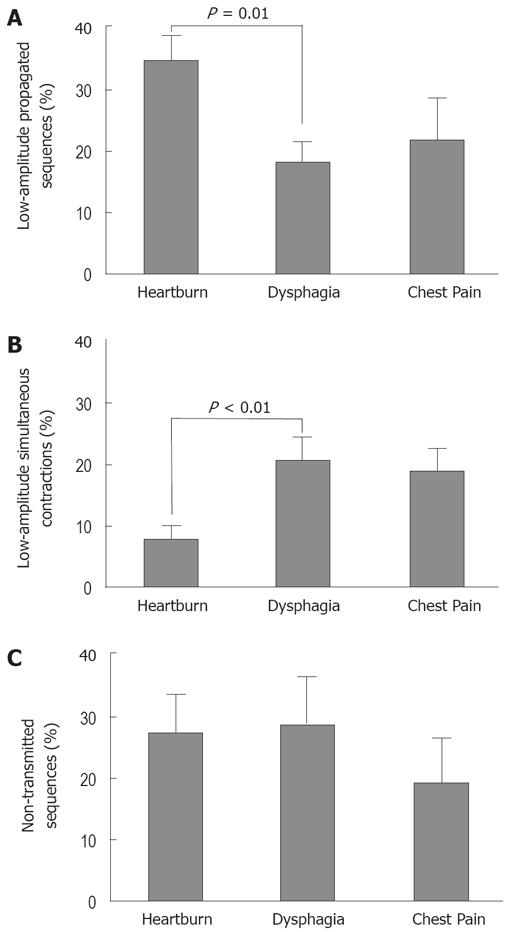
Figure 1 Proportions of low-amplitude propagated sequences (A), LASC (B), and NT (C) in the three predominant symptom subgroups.
Proportions are expressed as (mean ± SE) % of total swallows.
- Citation: Haack HG, Hansen RD, Malcolm A, Kellow JE. Ineffective oesophageal motility: Manometric subsets exhibit different symptom profiles. World J Gastroenterol 2008; 14(23): 3719-3724
- URL: https://www.wjgnet.com/1007-9327/full/v14/i23/3719.htm
- DOI: https://dx.doi.org/10.3748/wjg.14.3719


