Copyright
©2008 The WJG Press and Baishideng.
World J Gastroenterol. Jun 21, 2008; 14(23): 3650-3661
Published online Jun 21, 2008. doi: 10.3748/wjg.14.3650
Published online Jun 21, 2008. doi: 10.3748/wjg.14.3650
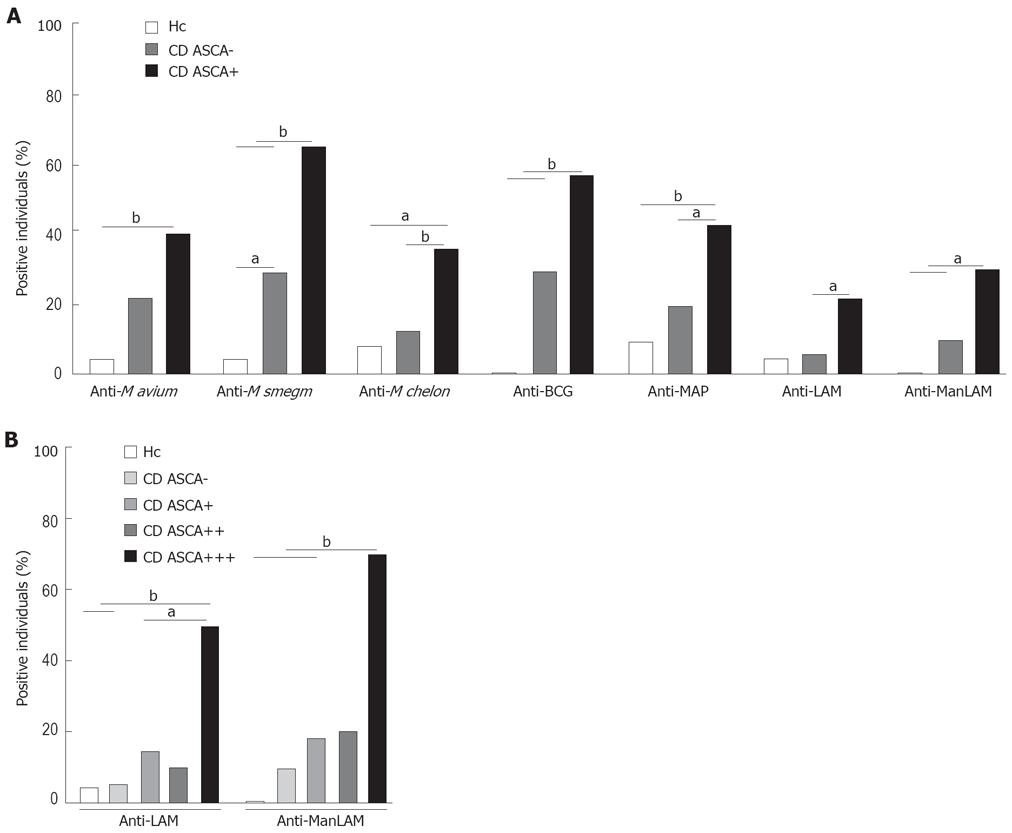
Figure 3 Association of anti-mycobacterial IgG with ASCA.
CD patients were grouped according to their ASCA status and their anti-mycobacterial IgG were determined in comparison with healthy controls (n = 25). A: ASCA- (n = 42), extinction values at 450 nm below the cut-off as determined by routine diagnostics (3 standard deviations above the average of 10 negative control sera); ASCA+ (n = 48) extinction values above the cut-off. According to the legend of Figure 1, percentages of IgG-positive individuals per group were determined for each antigen. B: ASCA-positive CD patients were further grouped according to the levels of ASCA and compared to healthy controls and UC patients. ASCA+ (n = 28), A450 clearly above, but less than double the cut-off value; ASCA++ (n = 10), A450 2 to 3 times higher than the cut-off value; ASCA+++ ( = 10), A450 higher than 3 times the cut-off value. According to legends of Figures 1 and 2A, percentages of anti-LAM and anti-ManLAM IgG-positive individuals in each group were determined. Asterisks indicate significant differences between the groups. aP < 0.05, bP < 0.01.
-
Citation: Müller S, Schaffer T, Schoepfer AM, Hilty A, Bodmer T, Seibold F. Partial overlap of anti-mycobacterial, and anti-
Saccharomyces cerevisiae mannan antibodies in Crohn’s disease. World J Gastroenterol 2008; 14(23): 3650-3661 - URL: https://www.wjgnet.com/1007-9327/full/v14/i23/3650.htm
- DOI: https://dx.doi.org/10.3748/wjg.14.3650


