Copyright
©2007 Baishideng Publishing Group Inc.
World J Gastroenterol. Dec 21, 2007; 13(47): 6441-6443
Published online Dec 21, 2007. doi: 10.3748/wjg.v13.i47.6441
Published online Dec 21, 2007. doi: 10.3748/wjg.v13.i47.6441
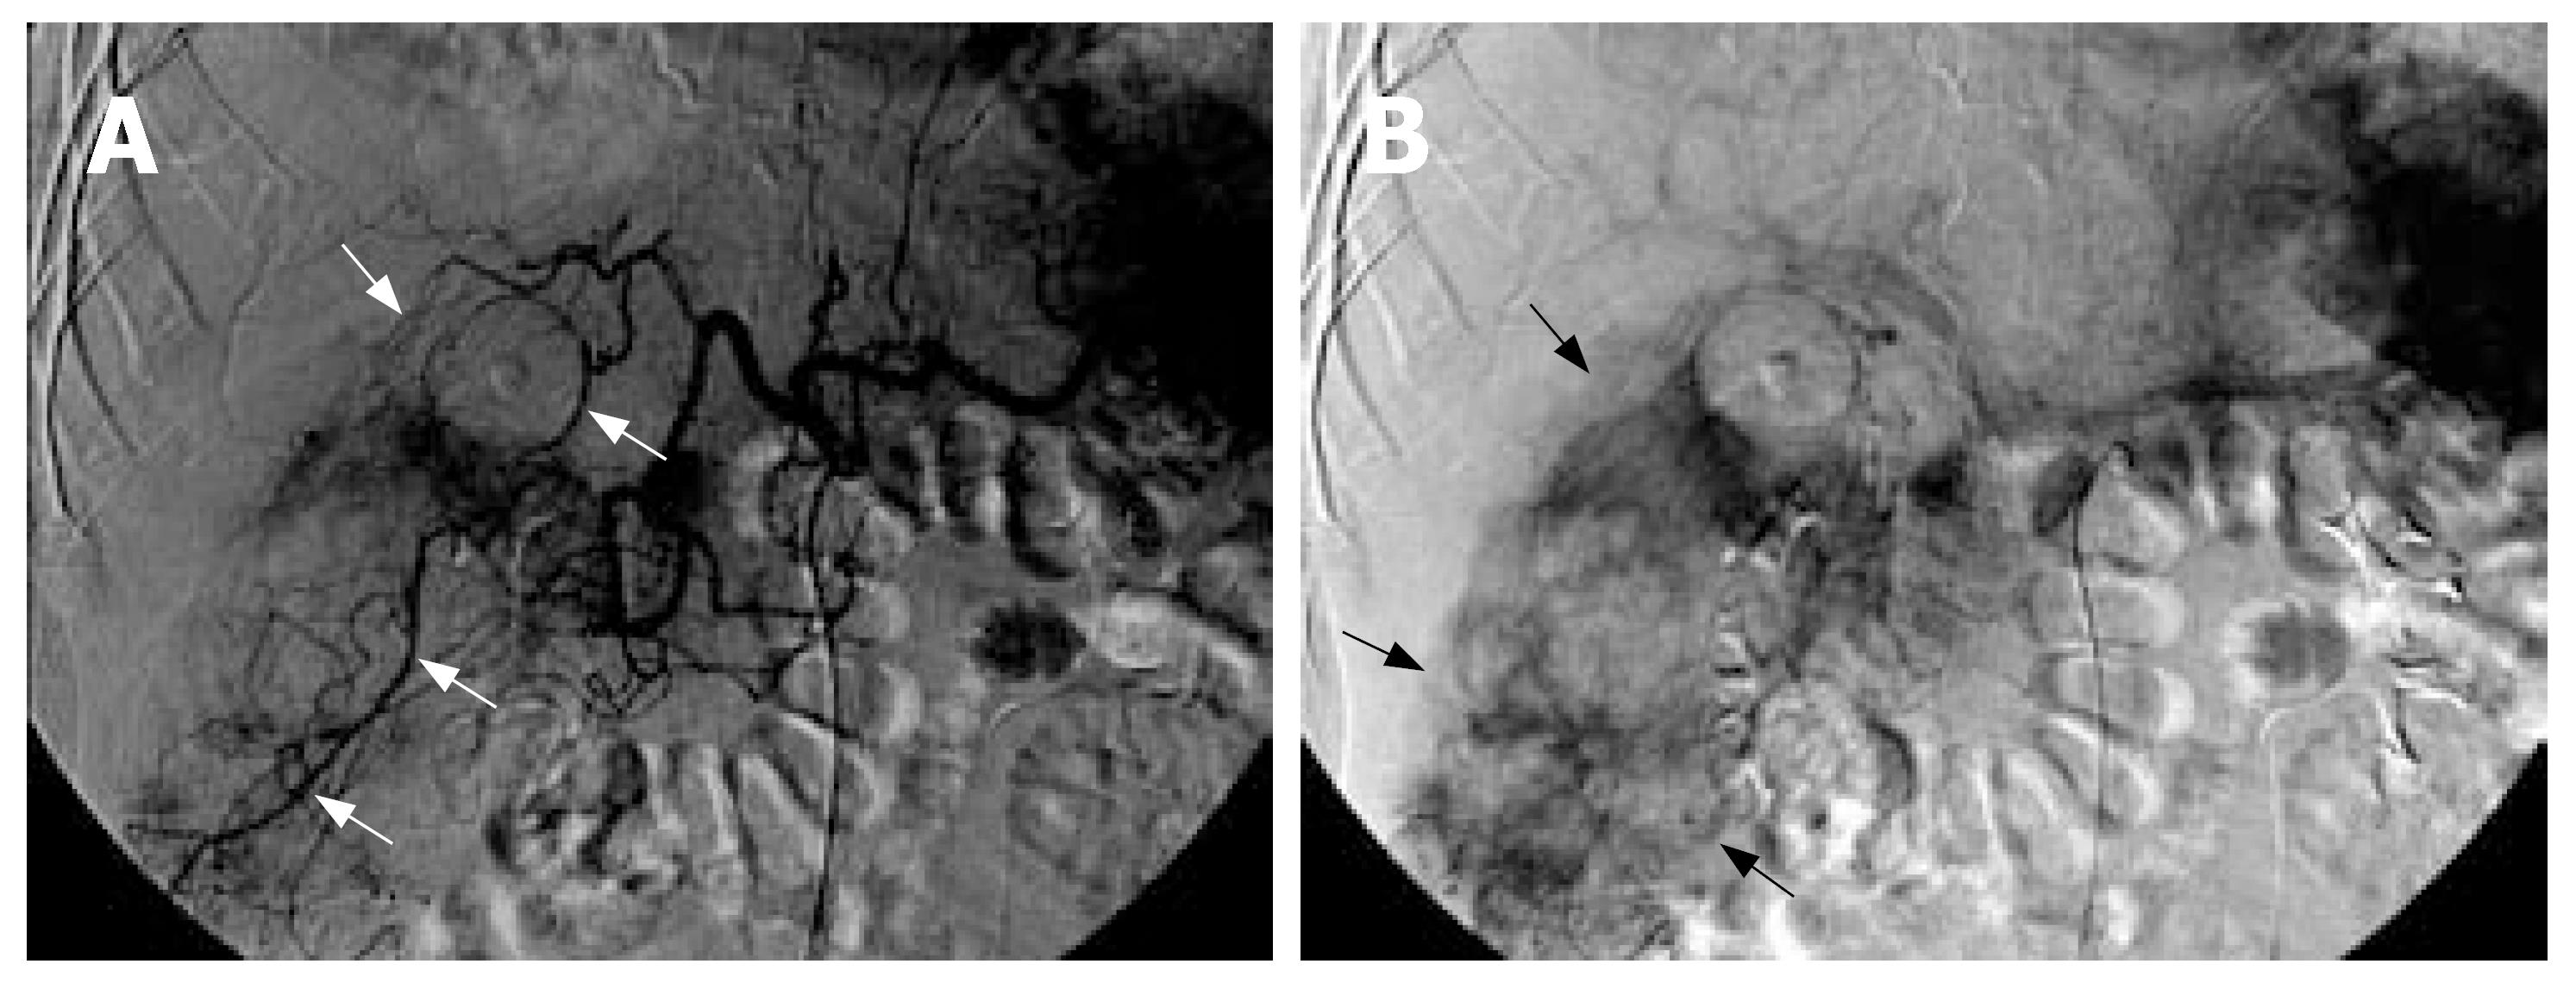
Figure 2 A: Arterial phase image of the celiac arteriogram shows hypertrophied right inferior hepatic arteries, cystic artery and omental branches of gastroepiploic artery (white arrows) supplying the hypervascular subhepatic mass; B: Venous phase shows prominent tumor stains in the peripheral portion of the huge subhepatic mass (black arrows).
- Citation: Chen HC, Chen CJ, Jeng CM, Yang CM. Malignant fibrous histiocytoma presenting as hemoperitoneum mimicking hepatocellular carcinoma rupture. World J Gastroenterol 2007; 13(47): 6441-6443
- URL: https://www.wjgnet.com/1007-9327/full/v13/i47/6441.htm
- DOI: https://dx.doi.org/10.3748/wjg.v13.i47.6441


