Copyright
©2007 Baishideng Publishing Group Inc.
World J Gastroenterol. Dec 21, 2007; 13(47): 6370-6378
Published online Dec 21, 2007. doi: 10.3748/wjg.v13.i47.6370
Published online Dec 21, 2007. doi: 10.3748/wjg.v13.i47.6370
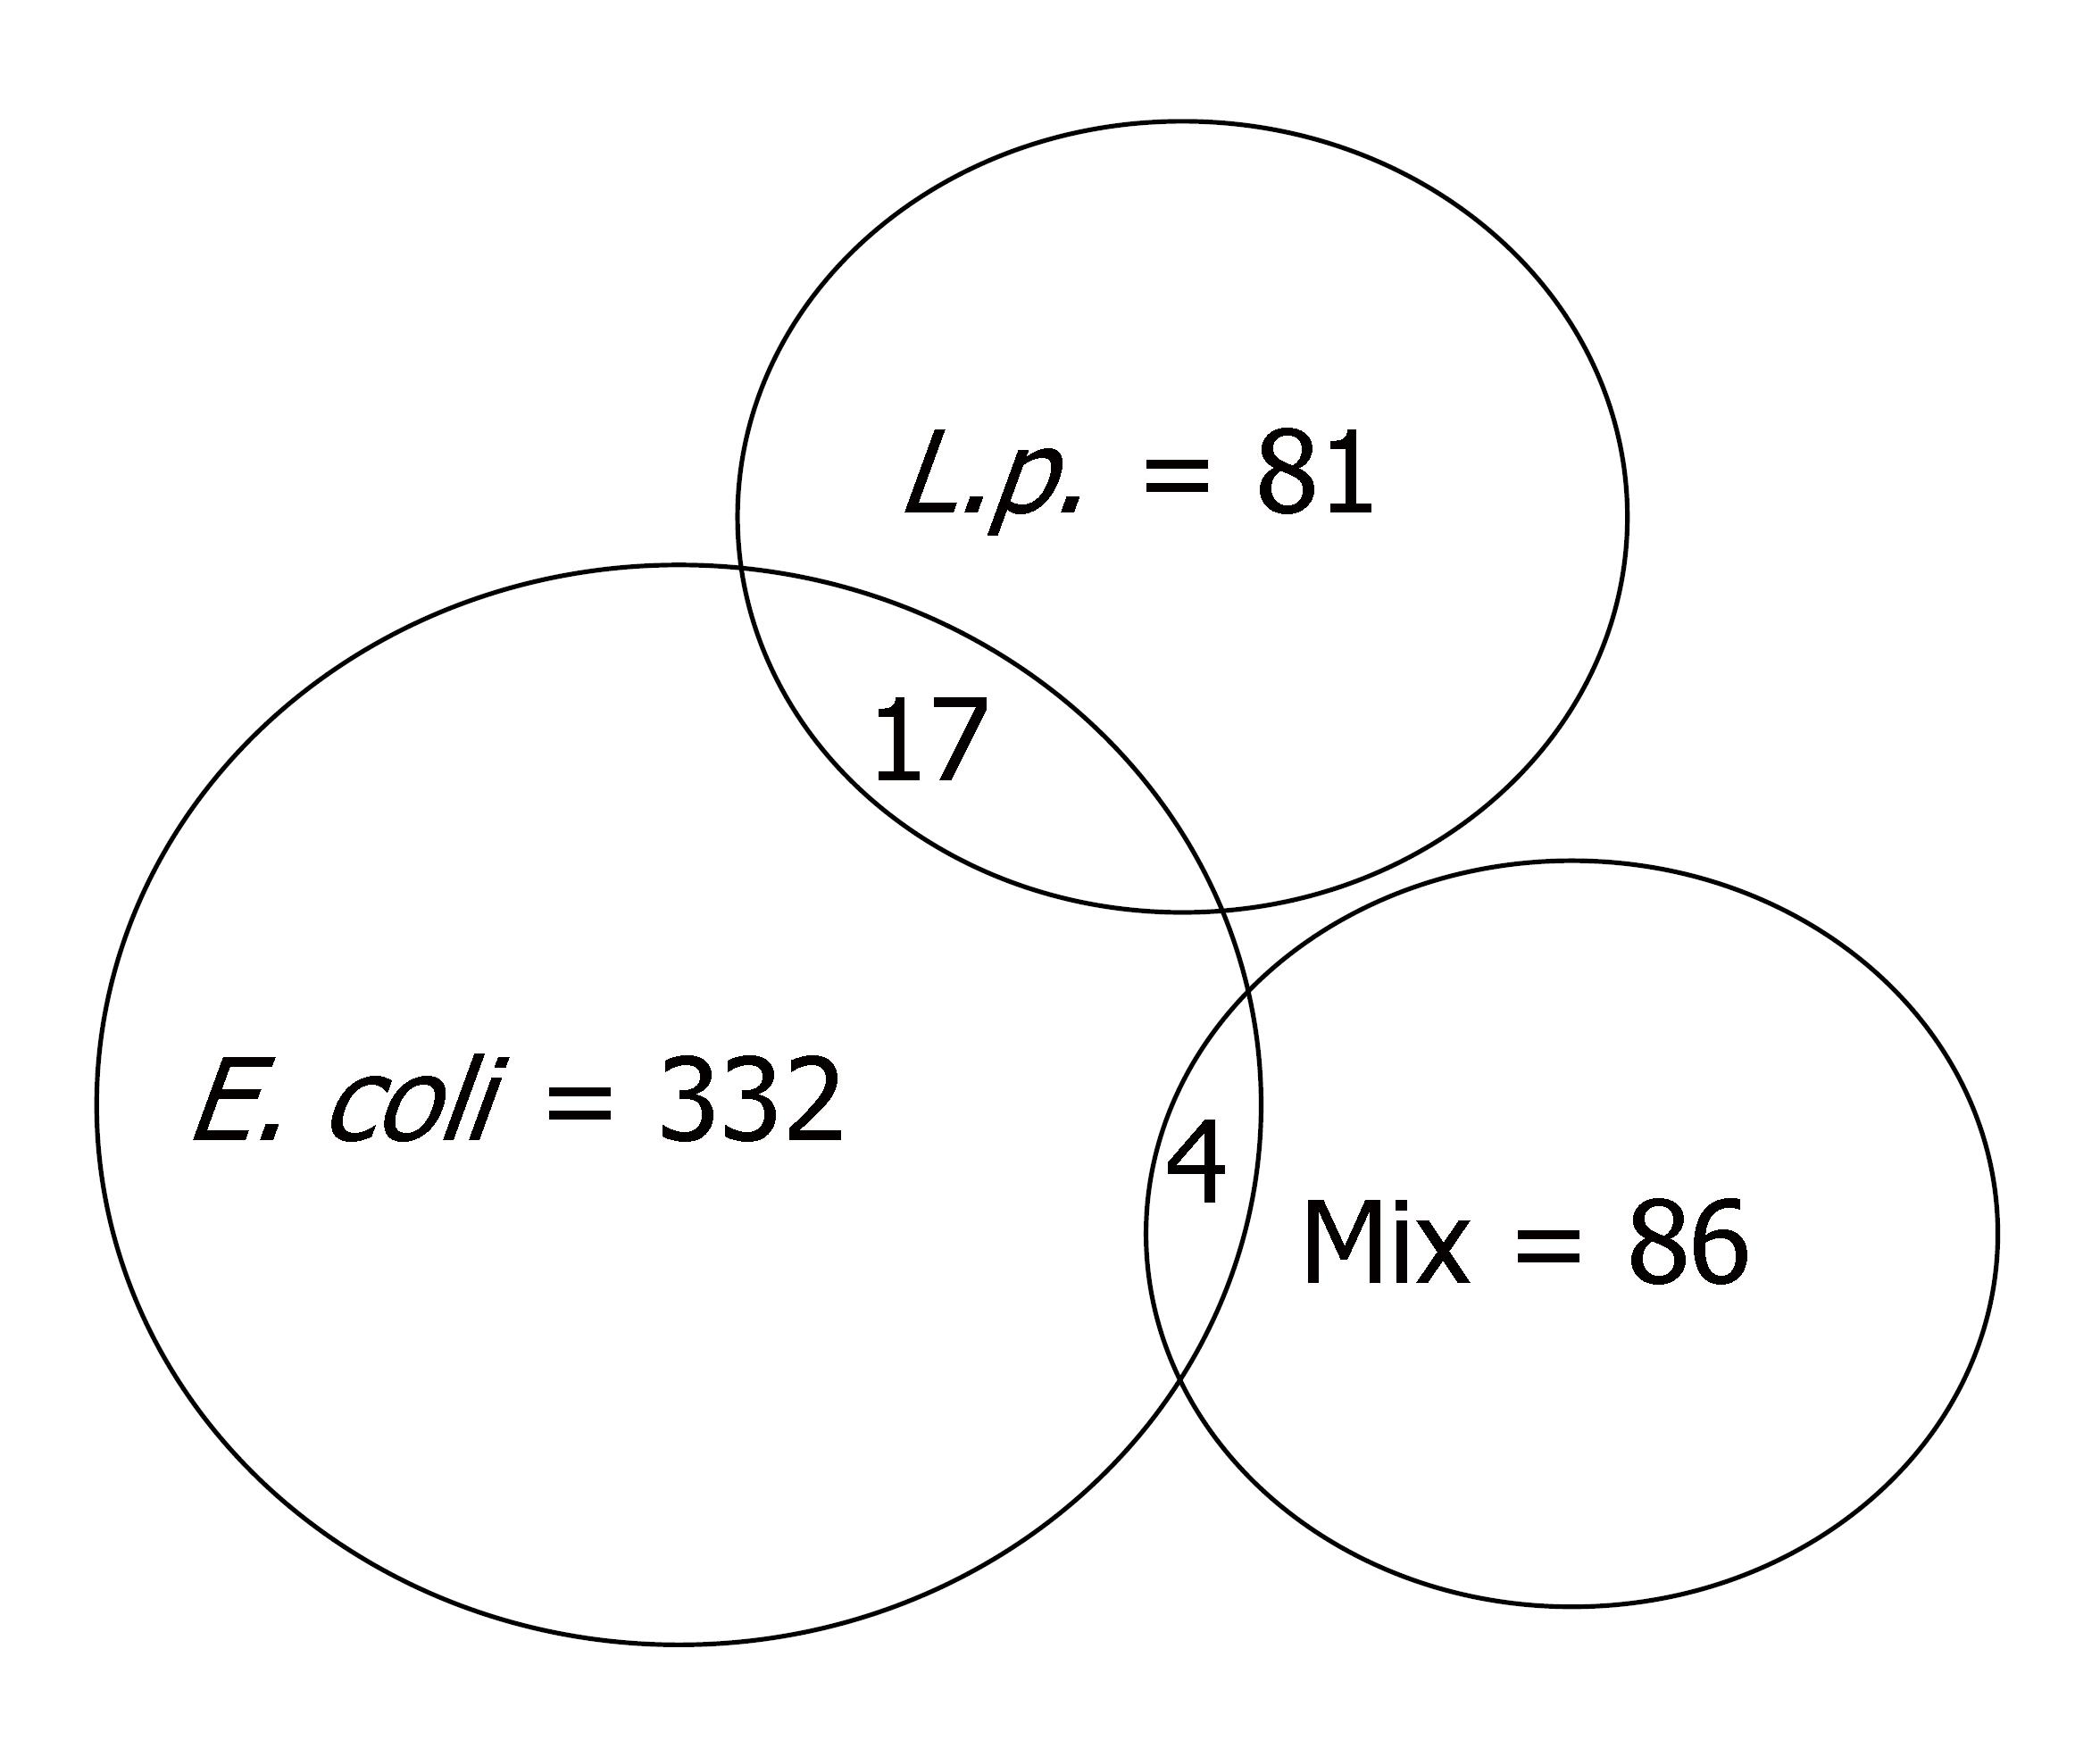
Figure 1 Schematic representation of the genes influenced by each treatment, and the overlapping (common) genes among treatments.
The relative gene expression after treatment was > 2-fold compared with the control.
-
Citation: Panigrahi P, Braileanu GT, Chen H, Stine OC. Probiotic bacteria change
Escherichia coli -induced gene expression in cultured colonocytes: Implications in intestinal pathophysiology. World J Gastroenterol 2007; 13(47): 6370-6378 - URL: https://www.wjgnet.com/1007-9327/full/v13/i47/6370.htm
- DOI: https://dx.doi.org/10.3748/wjg.v13.i47.6370


