Copyright
©2007 Baishideng Publishing Group Co.
World J Gastroenterol. Oct 7, 2007; 13(37): 4986-4995
Published online Oct 7, 2007. doi: 10.3748/wjg.v13.i37.4986
Published online Oct 7, 2007. doi: 10.3748/wjg.v13.i37.4986
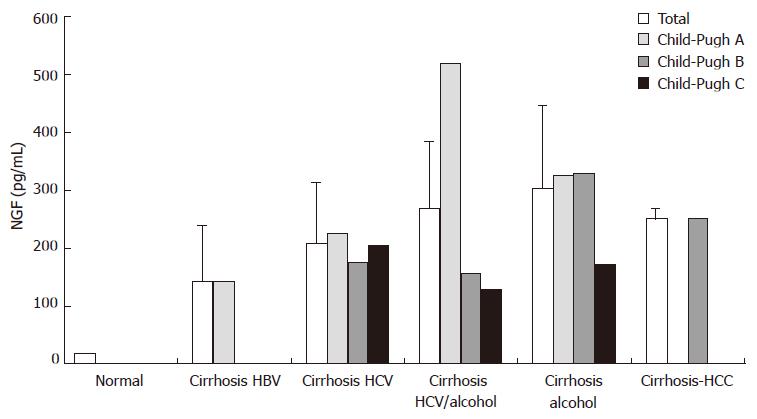
Figure 9 Bar diagram illustrating the circulating NGF levels, determined by test ELISA, in patients with documented cirrhosis/HCC.
NGF amounts, reported with regard to the etiology, is calculated either as mean ± SD (all patients examined) or as mean values for Child-Pugh class A (score = 5-6), for Child-Pugh class B (score = 7-9) and for Child-Pugh class C (score = 10-15). As a control, mean ± SD of circulating NGF levels from some healthy individuals is also reported.
- Citation: Rasi G, Serafino A, Bellis L, Lonardo MT, Andreola F, Zonfrillo M, Vennarecci G, Pierimarchi P, Vallebona PS, Ettorre GM, Santoro E, Puoti C. Nerve growth factor involvement in liver cirrhosis and hepatocellular carcinoma. World J Gastroenterol 2007; 13(37): 4986-4995
- URL: https://www.wjgnet.com/1007-9327/full/v13/i37/4986.htm
- DOI: https://dx.doi.org/10.3748/wjg.v13.i37.4986


