Copyright
©2007 Baishideng Publishing Group Co.
World J Gastroenterol. Jan 21, 2007; 13(3): 361-368
Published online Jan 21, 2007. doi: 10.3748/wjg.v13.i3.361
Published online Jan 21, 2007. doi: 10.3748/wjg.v13.i3.361
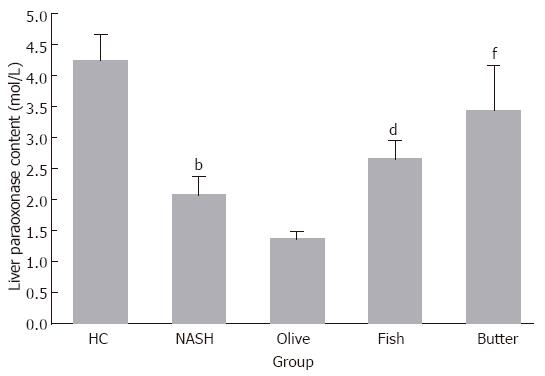
Figure 3 Hepatic paraoxonase contents (mol/L) in the different treatment groups.
bP < 0.01, dP < 0.01, fP < 0.01 vs olive oil group.
- Citation: Hussein O, Grosovski M, Lasri E, Svalb S, Ravid U, Assy N. Monounsaturated fat decreases hepatic lipid content in non-alcoholic fatty liver disease in rats. World J Gastroenterol 2007; 13(3): 361-368
- URL: https://www.wjgnet.com/1007-9327/full/v13/i3/361.htm
- DOI: https://dx.doi.org/10.3748/wjg.v13.i3.361


