Copyright
©2006 Baishideng Publishing Group Co.
World J Gastroenterol. Feb 28, 2006; 12(8): 1303-1307
Published online Feb 28, 2006. doi: 10.3748/wjg.v12.i8.1303
Published online Feb 28, 2006. doi: 10.3748/wjg.v12.i8.1303
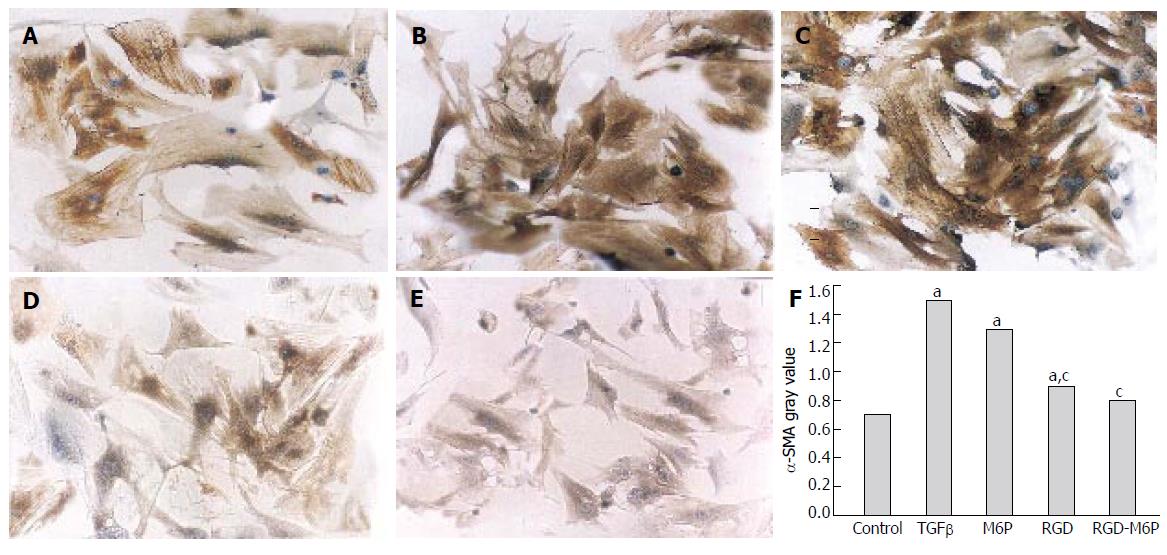
Figure 2 Immunocytochemical analysis of HSCs after cultured for 5 d (A), after treatment with TGF β1 (B) and M6P (C), weak positivity of α-SMA RGD (D) and RGD-M6P (E), and elevated expression of α-SMA (F) in HSCs.
aP < 0.05 vs control groups; cP < 0.05 vs TGF β1.
- Citation: Wang LS, Chen YW, Li DG, Lu HM. Arg-gly-asp-mannose-6-phosphate inhibits activation and proliferation of hepatic stellate cells in vitro. World J Gastroenterol 2006; 12(8): 1303-1307
- URL: https://www.wjgnet.com/1007-9327/full/v12/i8/1303.htm
- DOI: https://dx.doi.org/10.3748/wjg.v12.i8.1303


