Copyright
©2006 Baishideng Publishing Group Co.
World J Gastroenterol. Feb 28, 2006; 12(8): 1235-1242
Published online Feb 28, 2006. doi: 10.3748/wjg.v12.i8.1235
Published online Feb 28, 2006. doi: 10.3748/wjg.v12.i8.1235
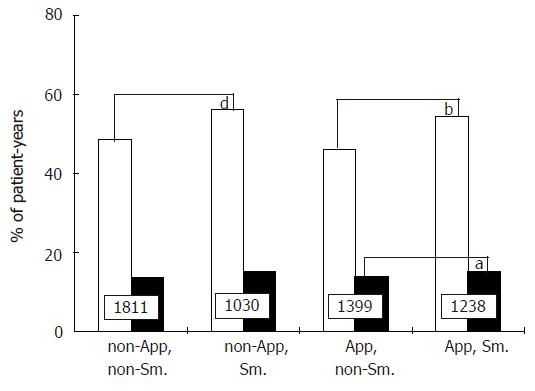
Figure 4 Percentages of patient-years with active disease (grey columns) and hospitalization (black columns), respectively, according to appendectomy and smoking status (App: appendectomized; Sm: smokers).
Numbers indicate the number of patient-years in each group. aP < 0.05 vs App, non-Sm.; bP < 0.001 vs App, non-Sm.; dP < 0.001 vs non-App, non-Sm.
- Citation: Cosnes J, Seksik P, Nion-Larmurier I, Beaugerie L, Gendre JP. Prior appendectomy and the phenotype and course of Crohn’s disease. World J Gastroenterol 2006; 12(8): 1235-1242
- URL: https://www.wjgnet.com/1007-9327/full/v12/i8/1235.htm
- DOI: https://dx.doi.org/10.3748/wjg.v12.i8.1235


