Copyright
©2006 Baishideng Publishing Group Co.
World J Gastroenterol. Dec 7, 2006; 12(45): 7346-7349
Published online Dec 7, 2006. doi: 10.3748/wjg.v12.i45.7346
Published online Dec 7, 2006. doi: 10.3748/wjg.v12.i45.7346
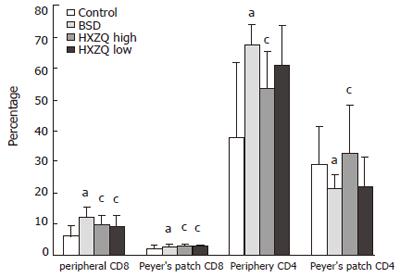
Figure 1 CD4+ and CD8+ cells in peripheral blood and Peyer’s patch were analyzed with flow cytometry.
Data represent mean ± SE. aP < 0.05 vs control group, cP < 0.05 vs BSD group.
- Citation: He YH, Zhao HY, Liu ZL, Lu C, Luo XJ, Lin SQ, Qian XW, Chen SL, Lu AP. Effects of huoxiangzhengqi liquid on enteric mucosal immune responses in mice with Bacillus dysenteriae and Salmonella typhimurium induced diarrhea. World J Gastroenterol 2006; 12(45): 7346-7349
- URL: https://www.wjgnet.com/1007-9327/full/v12/i45/7346.htm
- DOI: https://dx.doi.org/10.3748/wjg.v12.i45.7346


