Copyright
©2006 Baishideng Publishing Group Co.
World J Gastroenterol. Jan 28, 2006; 12(4): 588-594
Published online Jan 28, 2006. doi: 10.3748/wjg.v12.i4.588
Published online Jan 28, 2006. doi: 10.3748/wjg.v12.i4.588
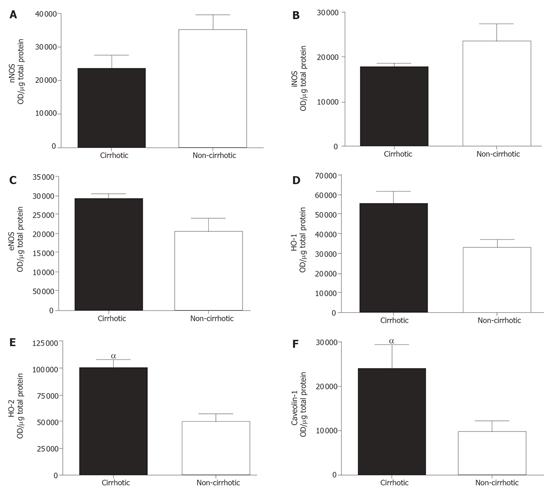
Figure 3 Protein expression in cirrhotic and non-cirrhotic patient livers were semi-quantitated via Western Blot.
Results were tabulated and presented. Both nNOS (A) and iNOS (B) were unchanged. eNOS (C), HO-1(D), HO-2(E) and Caveolin-1(F) protein expression were significantly increased in cirrhotic tissue. OD represents optical density. αP < 0.05.
- Citation: Goh BJ, Tan BT, Hon WM, Lee KH, Khoo HE. Nitric oxide synthase and heme oxygenase expressions in human liver cirrhosis. World J Gastroenterol 2006; 12(4): 588-594
- URL: https://www.wjgnet.com/1007-9327/full/v12/i4/588.htm
- DOI: https://dx.doi.org/10.3748/wjg.v12.i4.588


