Copyright
©2006 Baishideng Publishing Group Co.
World J Gastroenterol. Oct 7, 2006; 12(37): 5959-5963
Published online Oct 7, 2006. doi: 10.3748/wjg.v12.i37.5959
Published online Oct 7, 2006. doi: 10.3748/wjg.v12.i37.5959
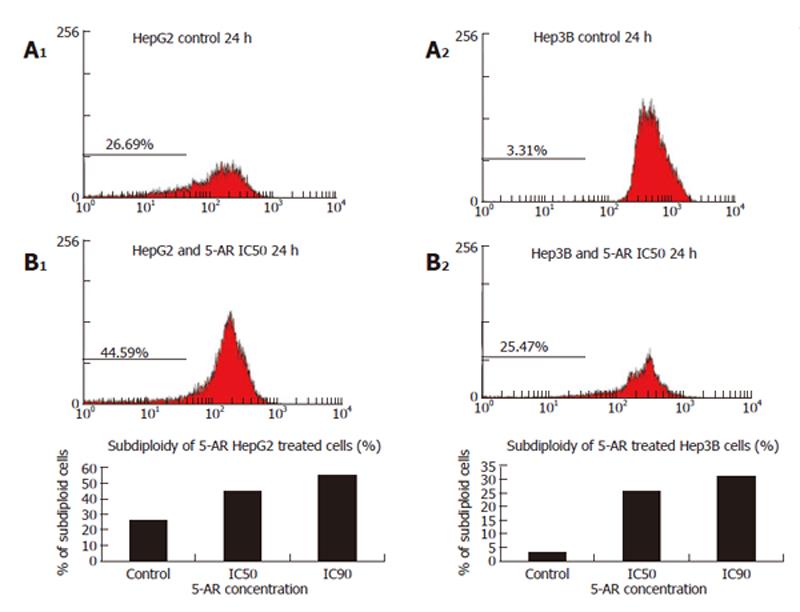
Figure 4 5-AR-treated HepG2 and Hep3B cells showing a subG0 population detected by flow cytometry.
Treated or control cells were stained with propidium iodide and analyzed by flow cytometry. Left: (A1) control untreated HepG2 cells, (B1) HepG2 cells treated for 24 h with 5-AR IC50; Right: (A2) control untreated Hep3B cells, (B2) Hep3B cells treated for 24 h with 5-AR IC50. Results are from one experiment that is representative of three similar ones.
- Citation: Barbini L, Lopez P, Ruffa J, Martino V, Ferraro G, Campos R, Cavallaro L. Induction of apoptosis on human hepatocarcinoma cell lines by an alkyl resorcinol isolated from Lithraea molleoides. World J Gastroenterol 2006; 12(37): 5959-5963
- URL: https://www.wjgnet.com/1007-9327/full/v12/i37/5959.htm
- DOI: https://dx.doi.org/10.3748/wjg.v12.i37.5959


