Copyright
©2005 Baishideng Publishing Group Inc.
World J Gastroenterol. Feb 28, 2005; 11(8): 1161-1166
Published online Feb 28, 2005. doi: 10.3748/wjg.v11.i8.1161
Published online Feb 28, 2005. doi: 10.3748/wjg.v11.i8.1161
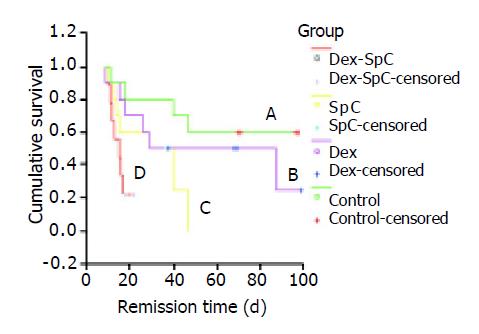
Figure 4 Curve of survival time after liver transplantation in each group.
Pooled over strata (statistic = 11.13, P = 0.011), Pairwise over strata, D vs A (statistic = 6.93, P = 0.0085), B (statistic = 4.57, P = 0.0326), C (statistic = 2.24 , P = 0.1342). A: control group, B: Dex group, C: SpC group, D: Dex-SpC group.
- Citation: Liu J, Gao Y, Wang S, Sun EW, Wang Y, Zhang Z, Shan YQ, Zhong SZ. Effect of operation-synchronizing transfusion of apoptotic spleen cells from donor rats on acute rejection of recipient rats after liver transplantation. World J Gastroenterol 2005; 11(8): 1161-1166
- URL: https://www.wjgnet.com/1007-9327/full/v11/i8/1161.htm
- DOI: https://dx.doi.org/10.3748/wjg.v11.i8.1161


