Copyright
©2005 Baishideng Publishing Group Inc.
World J Gastroenterol. Nov 28, 2005; 11(44): 6910-6919
Published online Nov 28, 2005. doi: 10.3748/wjg.v11.i44.6910
Published online Nov 28, 2005. doi: 10.3748/wjg.v11.i44.6910
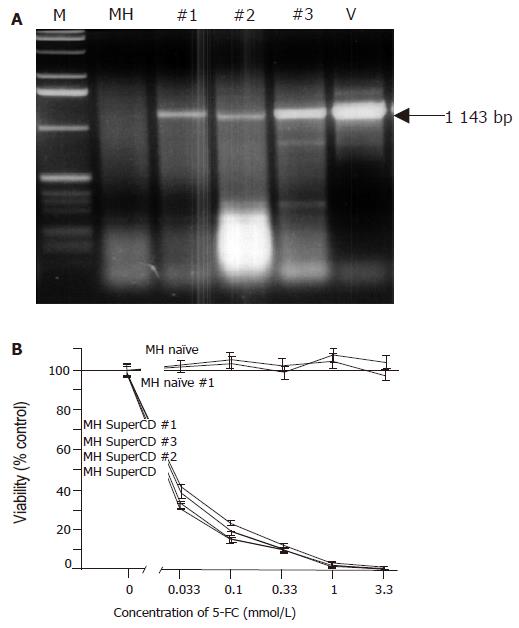
Figure 3 Molecular and functional analysis of subcutaneously grown control tumors explanted on d 18 (saline-treated MH SuperCD/MH naïve tumors).
A: Agarose gel electrophoresis of SuperCD DNA-specific PCR products. Lane M: marker DNA ladder; lane MH: MH parental cell line (no transgene; negative control; PCR performed with 1 μg of DNA); lanes 1-3: PCR amplifications performed on MH SuperCD tumor tissues of animals 1, 2, 3 (PCR performed with 1–3 µg of DNA); lane V: vector control lane (PCR performed with 1 pg of pLXSN-SuperCD). Arrow: indicates 1 143-bp SuperCD-specific amplification product. B: SRB cytotoxicity assay with recultured tumor cells explanted after 18 d of subcutaneous growth. As in Figure 2, cytotoxicity was measured after 5-FC treatment for 4 d in vitro. MH naïve: negative control with MH parental cell line (no transgene; no animal passage); MH naïve, #1: MH naïve tumor explanted from a saline-treated animal (control); MH SuperCD, cell line: MH SuperCD parental cell line (control; no animal passage); MH SuperCD 1, 2, 3, tumor passage: MH SuperCD tumors explanted from saline-treated animals 1, 2, 3. All values were referred to that of the untransduced control cells and are given as percentage of surviving cells (control: 100%). All experiments were carried out in quadruplicate. Viability values plotted represent fitted medians and 95%CI.
- Citation: Graepler F, Lemken ML, Wybranietz WA, Schmidt U, Smirnow I, Groß CD, Spiegel M, Schenk A, Graf H, Lauer UA, Vonthein R, Gregor M, Armeanu S, Bitzer M, Lauer UM. Bifunctional chimeric SuperCD suicide gene -YCD: YUPRT fusion is highly effective in a rat hepatoma model. World J Gastroenterol 2005; 11(44): 6910-6919
- URL: https://www.wjgnet.com/1007-9327/full/v11/i44/6910.htm
- DOI: https://dx.doi.org/10.3748/wjg.v11.i44.6910


