Copyright
©2005 Baishideng Publishing Group Inc.
World J Gastroenterol. May 28, 2005; 11(20): 3165-3166
Published online May 28, 2005. doi: 10.3748/wjg.v11.i20.3165
Published online May 28, 2005. doi: 10.3748/wjg.v11.i20.3165
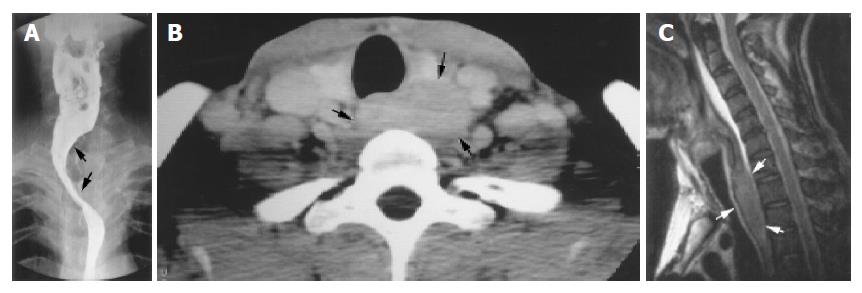
Figure 1 A: Barium esophagogram shows extraluminal compression and right side deviation of the upper esophagus (arrows); B: Enhanced CT scan at the level of the lower neck shows a mildly lobulated homogeneous mass (arrows) posterior to the trachea; C: T2 weighted sagittal MR image shows a slightly inhomogeneous, enlongated mass (arrows) with compression on the posterior wall of the trachea, mimicking an esophageal submucosal mass.
- Citation: Ko SF, Tsai YH, Huang HY, Ng SH, Fang FM, Tang Y, Sung MT, Hsieh MJ. Retrotracheal thymoma masquerading as esophageal submucosal tumor. World J Gastroenterol 2005; 11(20): 3165-3166
- URL: https://www.wjgnet.com/1007-9327/full/v11/i20/3165.htm
- DOI: https://dx.doi.org/10.3748/wjg.v11.i20.3165


