Copyright
©2005 Baishideng Publishing Group Inc.
World J Gastroenterol. Apr 28, 2005; 11(16): 2508-2512
Published online Apr 28, 2005. doi: 10.3748/wjg.v11.i16.2508
Published online Apr 28, 2005. doi: 10.3748/wjg.v11.i16.2508
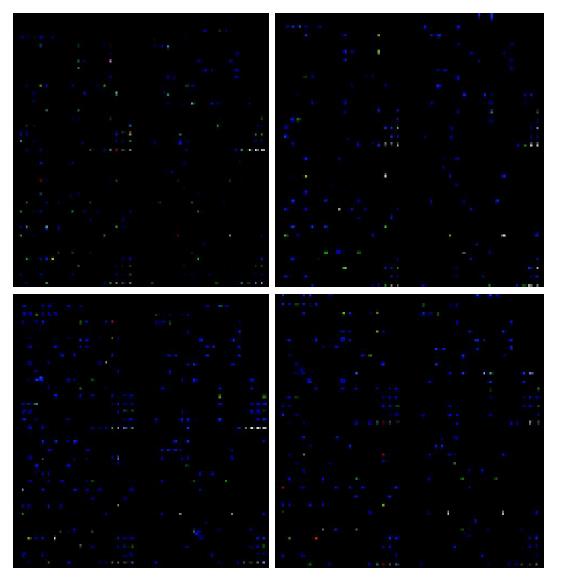
Figure 2 U937 mRNA expression analysis using Mergen cDNA arrays.
These maps revealed a number of genes that were significantly expressed in controls and MCP-1 treated cells, with an expression ratio above 2 (the red color dot, more red color dots indicate more highly expressed genes) or below 0.5 (the blue color dot, more blue color dots indicate meagerly expressed genes). Results were the mean from two separate experiments and were arranged in order of decreasing relative expression after treated with MCP-1 compared with untreated controls. A correlation analysis of the results from the two separate experiments showed that the findings were highly reproducible, because r = 0.897 for the 25 genes with the highest relative mRNA expression after MCP-1 treatment.
- Citation: Bian GX, Miao H, Qiu L, Cao DM, Guo BY. Profiling of differentially expressed chemotactic-related genes in MCP-1 treated macrophage cell line using human cDNA arrays. World J Gastroenterol 2005; 11(16): 2508-2512
- URL: https://www.wjgnet.com/1007-9327/full/v11/i16/2508.htm
- DOI: https://dx.doi.org/10.3748/wjg.v11.i16.2508


