Copyright
©The Author(s) 2004.
World J Gastroenterol. Oct 15, 2004; 10(20): 3026-3033
Published online Oct 15, 2004. doi: 10.3748/wjg.v10.i20.3026
Published online Oct 15, 2004. doi: 10.3748/wjg.v10.i20.3026
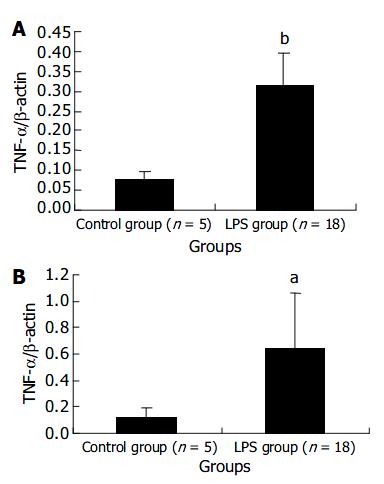
Figure 2 Transcript levels of TNF-α mRNA in liver (A) and spleen (B) at 120 min after LPS administration.
aP < 0.05 vs con-trol group, bP < 0.01 vs control group.
- Citation: Ji XH, Sun KY, Feng YH, Yin GQ. Changes of inflammation-associated cytokine expressions during early phase of experimental endotoxic shock in macaques. World J Gastroenterol 2004; 10(20): 3026-3033
- URL: https://www.wjgnet.com/1007-9327/full/v10/i20/3026.htm
- DOI: https://dx.doi.org/10.3748/wjg.v10.i20.3026


