Copyright
©The Author(s) 2004.
World J Gastroenterol. Oct 1, 2004; 10(19): 2890-2893
Published online Oct 1, 2004. doi: 10.3748/wjg.v10.i19.2890
Published online Oct 1, 2004. doi: 10.3748/wjg.v10.i19.2890
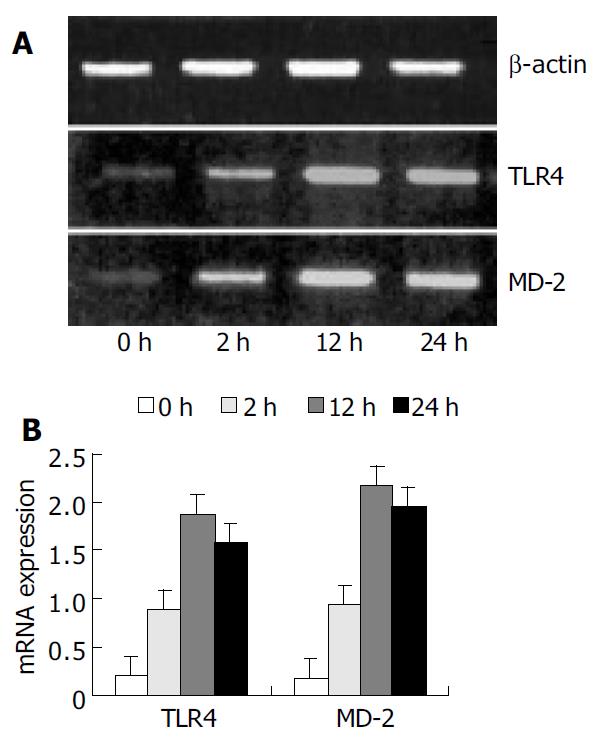
Figure 1 Expression of TLR4 and MD-2 mRNA by RT-PCR analysis.
A: PCR products were electrophoresed on agarose gels and photographed. B: Quantitative data of mRNA levels were shown as the ratio of relative absorbance and expressed as mean ± SD. Expression of TLR4 and MD-2 mRNA were sig-nificantly increased in the IR group compared with the con-trol group (P < 0.01).
- Citation: Peng Y, Gong JP, Liu CA, Li XH, Gan L, Li SB. Expression of toll-like receptor 4 and MD-2 gene and protein in Kupffer cells after ischemia-reperfusion in rat liver graft. World J Gastroenterol 2004; 10(19): 2890-2893
- URL: https://www.wjgnet.com/1007-9327/full/v10/i19/2890.htm
- DOI: https://dx.doi.org/10.3748/wjg.v10.i19.2890


