Copyright
©The Author(s) 2004.
World J Gastroenterol. Aug 1, 2004; 10(15): 2195-2200
Published online Aug 1, 2004. doi: 10.3748/wjg.v10.i15.2195
Published online Aug 1, 2004. doi: 10.3748/wjg.v10.i15.2195
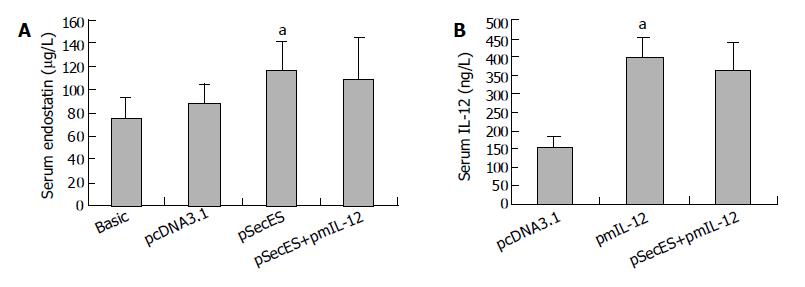
Figure 3 Increase of mice serum endostatin levels or IL-12 levels after gene therapy.
A: Serum endostatin levels of mice treated with pcDNA3.1/PVP, pSecES/PVP, pSecES + pmIL-12/PVP or not inoculated with H22 cells (basic levels). Each bar represents mean ± SD for six mice. aP < 0.05 vs pcDNA3.1 group. B: Serum IL-12 levels of mice treated with pcDNA3.1/PVP, pmIL-12/PVP, pSecES + pmIL-12/PVP. Each bar represents mean ± SD for six mice. aP < 0.05 vs pcDNA3.1 group.
- Citation: Li PY, Lin JS, Feng ZH, He YF, Zhou HJ, Ma X, Cai XK, Tian DA. Combined gene therapy of endostatin and interleukin 12 with polyvinylpyrrolidone induces a potent antitumor effect on hepatoma. World J Gastroenterol 2004; 10(15): 2195-2200
- URL: https://www.wjgnet.com/1007-9327/full/v10/i15/2195.htm
- DOI: https://dx.doi.org/10.3748/wjg.v10.i15.2195


