Copyright
©The Author(s) 2004.
World J Gastroenterol. Jan 1, 2004; 10(1): 91-95
Published online Jan 1, 2004. doi: 10.3748/wjg.v10.i1.91
Published online Jan 1, 2004. doi: 10.3748/wjg.v10.i1.91
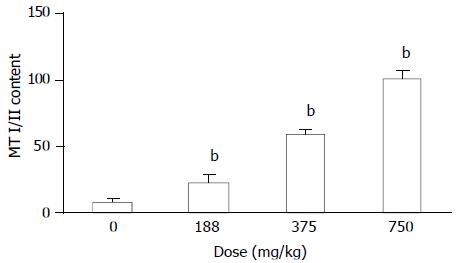
Figure 6 MT concentration in livers of MT+/+ mice detected by radio-immunoassay.
All the values were expressed as -χ±s. ANOVA with subsequent post hoc’s test was performed for comparison of AI. bSignificant difference at P < 0.01 when com-pared with the corresponding control group.
- Citation: Jia G, Gu YQ, Chen KT, Lu YY, Yan L, Wang JL, Su YP, Wu JCG. Protective role of metallothionein (I/II) against pathological damage and apoptosis induced by dimethylarsinic acid. World J Gastroenterol 2004; 10(1): 91-95
- URL: https://www.wjgnet.com/1007-9327/full/v10/i1/91.htm
- DOI: https://dx.doi.org/10.3748/wjg.v10.i1.91


