Copyright
©The Author(s) 2003.
World J Gastroenterol. Nov 15, 2003; 9(11): 2474-2479
Published online Nov 15, 2003. doi: 10.3748/wjg.v9.i11.2474
Published online Nov 15, 2003. doi: 10.3748/wjg.v9.i11.2474
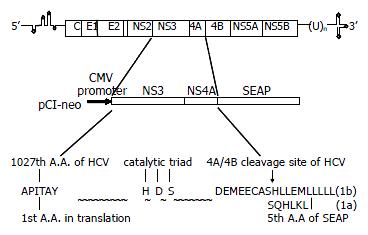
Figure 1 Schematic diagram of the pCI-neo-NS3/4A-SEAP and pCI-neo-RNS3/4A-SEAP expression vectors.
The SEAP gene, which has N-terminal signal sequence, was fused in-frame to the HCV sequence encoding the full-length NS3 proteins followed by the NS4A cofactor. Amino acid sequences of (R)NS3/4A and SEAP in the fusion regions are shown by capitalized, bold characters. The cleavage site between NS4A and NS4B is indicated by arrow. HDS is the catalytic triad of NS3 protease.
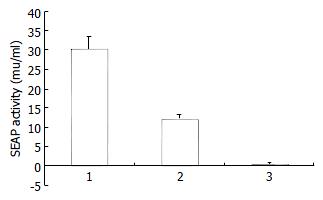
Figure 2 SEAP activity in the media of the transfected HepG2 cells.
Lane 1: pCMV-SEAP, Lane 2: pCI-neo-NS3/4A-SEAP, Lane 3: pCI-neo-NS3/4A (TGA) (as negative control).
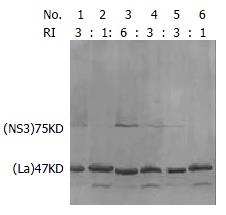
Figure 3 Western blot analysis of NS3 protein level in transfected Cos7 cells (Lane1, 3, 5) and HepG2 cells (Lane 2, 4, 6).
Lane 1, 2 pCI-neo-NS3/4A-SEAP (1b type), Lane 3, 4 pCI-neo-NS3/4A (TGA) (control), Lane 5, 6 pCI-neo-RNS3/4A-SEAP (1a type). Intensity of hybridization signal was measured by densitometry, and the relative intensities (RI) of NS3 to cellular protein La in samples are indicated.
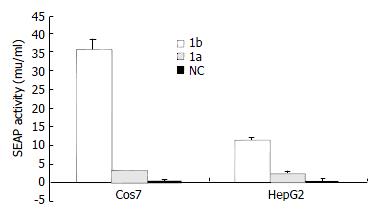
Figure 4 SEAP activity in the media of the transfected HepG2 and Cos7 cells.
1b: pCI-neo-NS3/4A-SEAP; 1a: pCI-neo-RNS3/4A-SEAP; NC: pCI-neo-NS3/4A (TGA) (as negative control).
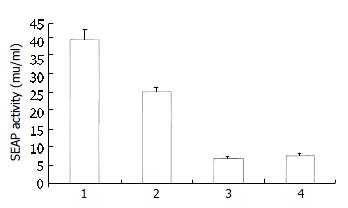
Figure 5 SEAP activity in the media of Cos7-derived stably expressing cell lines.
Lane 1, 2: 1b type stable expression cell lines; Lane 3, 4: 1a type stable expression cell lines.
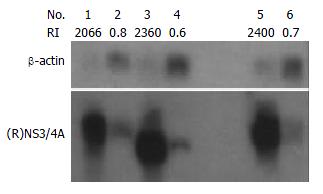
Figure 6 Northern blot analysis of NS3/4A mRNA level in transfected Cos7 cells (Lane 1, 3, 5) and HepG2 cells (Lane 2, 4, 6).
Lane 1, 2 pCI-neo-NS3/4A-SEAP (1b type); Lane 3, 4 pCI-neo-NS3/4A (TGA) (control); Lane 5, 6 pCI-neo-RNS3/4A-SEAP (1a type); Intensity of hybridization signal was measured by densitometry, and the relative intensities of NS3/4A signal to β-actin are indicated below the lane No.
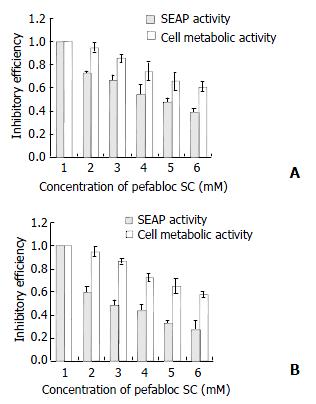
Figure 7 SEAP activity and viability of Cos7 stable cells treated with Pefabloc SC.
The SEAP activity and viability of cells were measured with colorimetric and alamar BlueTM assay according to manufactures recommendations. Each assay was performed in triplicate. A: 1b type stable expression cell lines, B: 1a type stable expression cell lines. 1: no treatment, 2: 0.1 mM, 3: 0.2 mM, 4: 0.4 mM, 5: 0.5 mM, 6: 0.6 mM.
- Citation: Mao HX, Lan SY, Hu YW, Xiang L, Yuan ZH. Establishment of a cell-based assay system for hepatitis C virus serine protease and its primary applications. World J Gastroenterol 2003; 9(11): 2474-2479
- URL: https://www.wjgnet.com/1007-9327/full/v9/i11/2474.htm
- DOI: https://dx.doi.org/10.3748/wjg.v9.i11.2474


