Copyright
©The Author(s) 2024.
World J Gastroenterol. May 7, 2024; 30(17): 2332-2342
Published online May 7, 2024. doi: 10.3748/wjg.v30.i17.2332
Published online May 7, 2024. doi: 10.3748/wjg.v30.i17.2332
Figure 1 Schematic representation of endoanal ultrasound technique with the linear transducer positioned 2 cm above the anorectal junction.
Figure 2 Characteristic of the waveform and measurement of the arterial systolic peak.
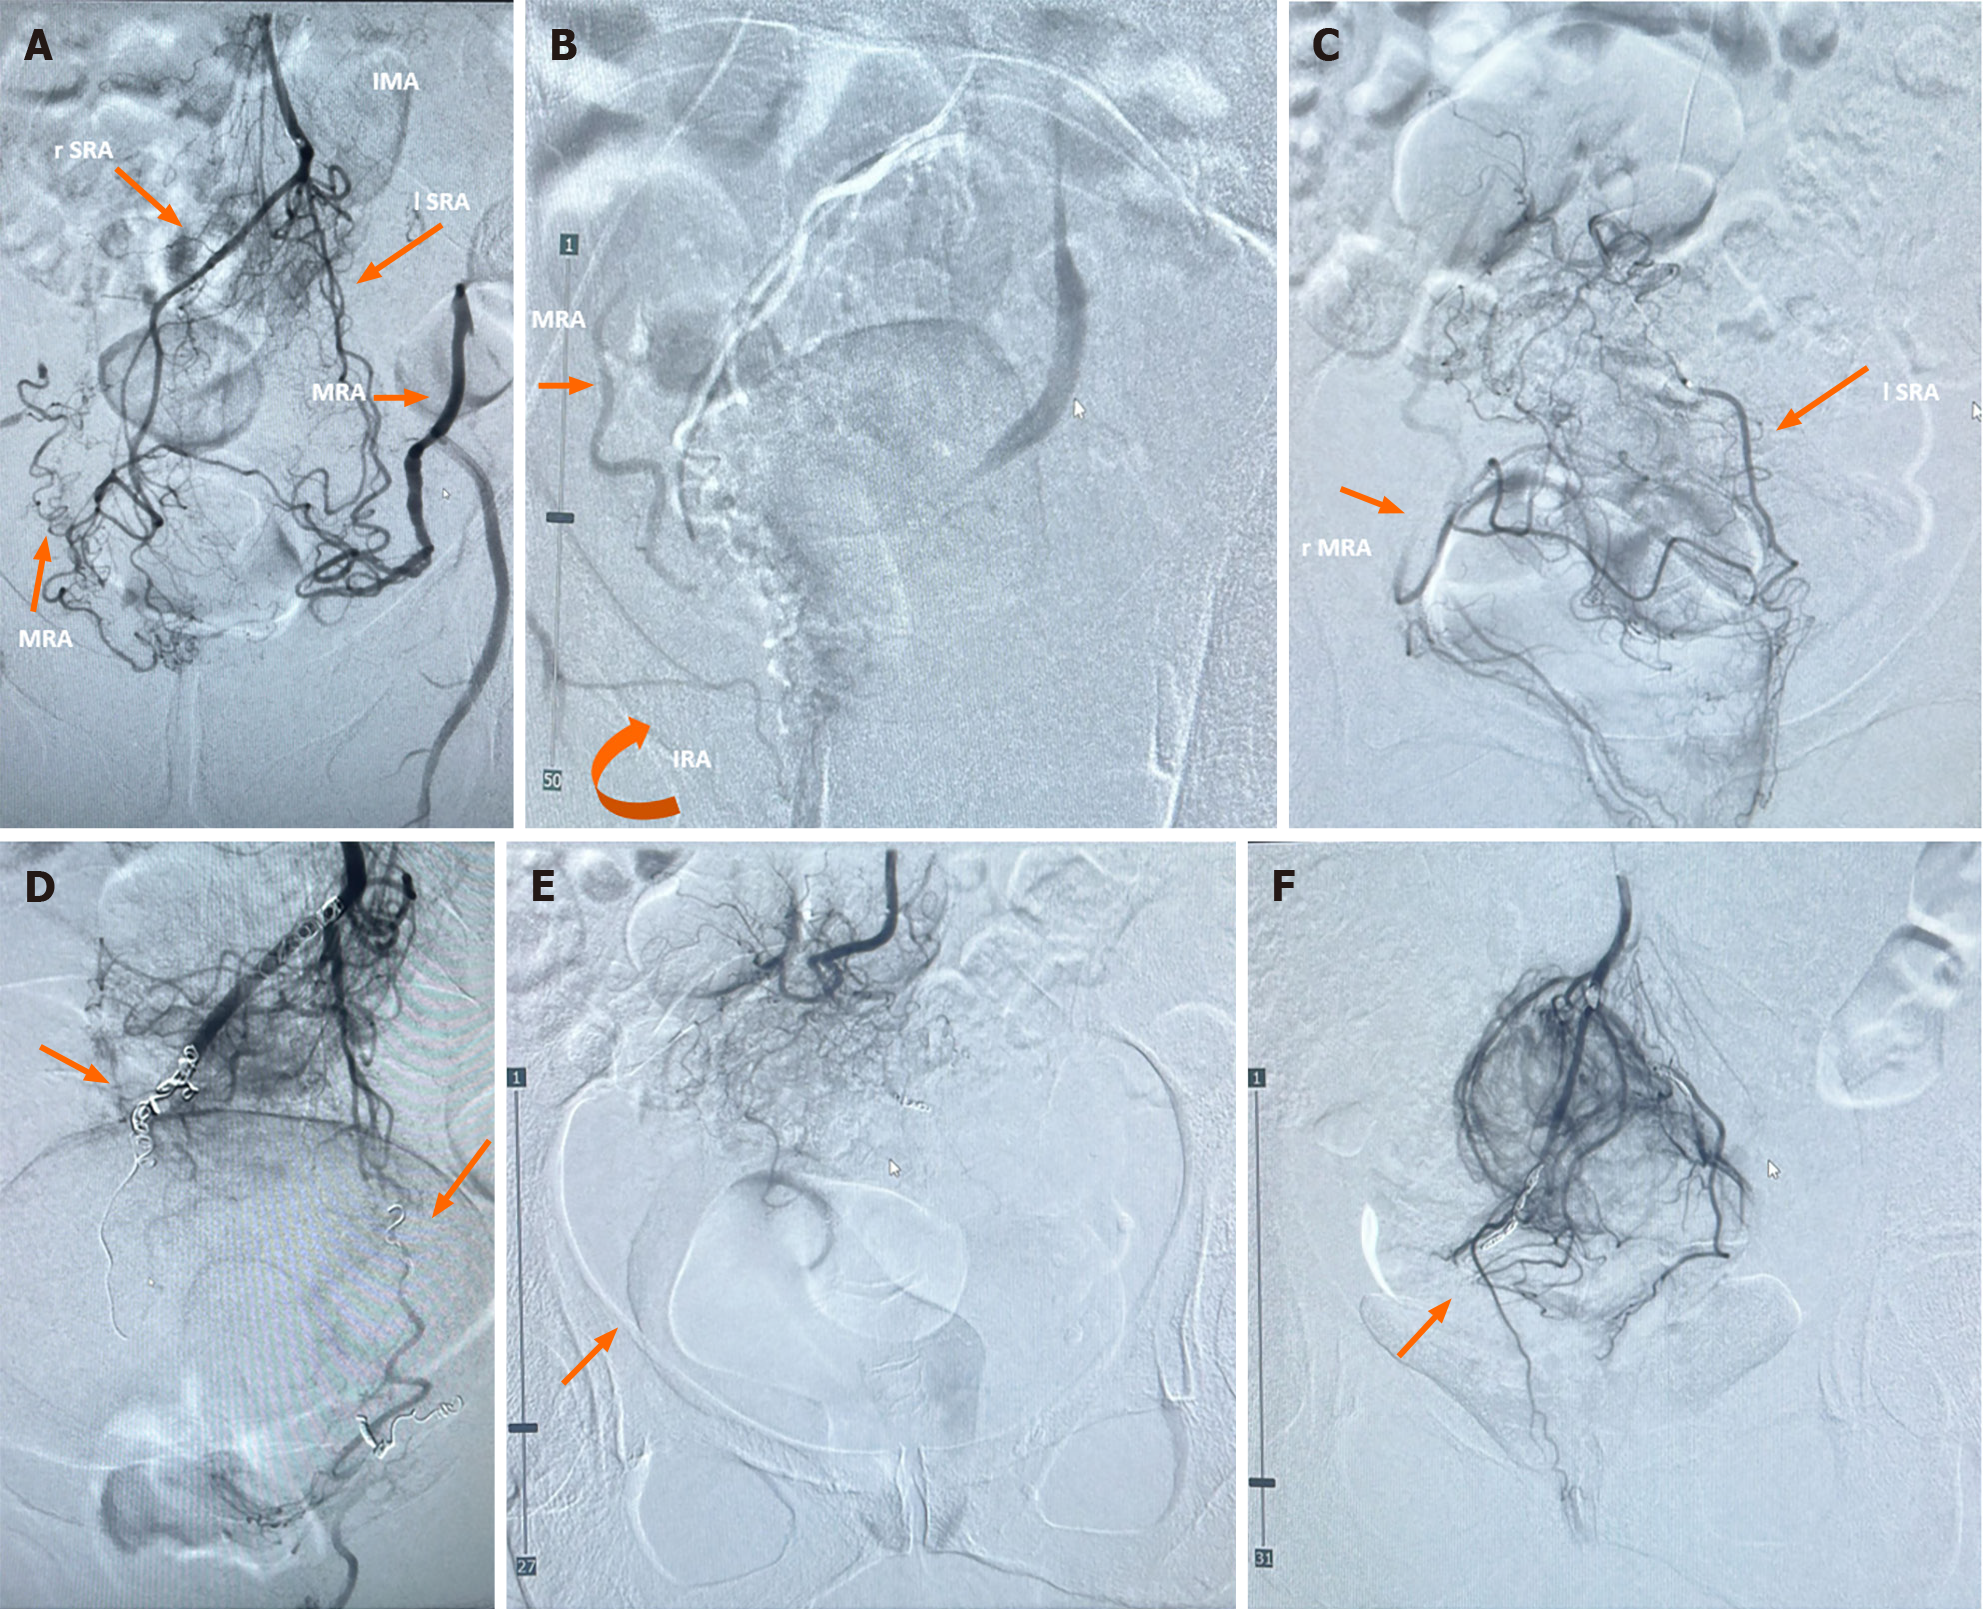
Figure 3 Pre-treatment and post-treatment angiography.
A: Case 1, anastomosis between superior (SRA) and middle (MRA) rectal arteries, bilaterally; B: Case 5, anastomosis between right MRA and inferior (IRA) rectal arteries; C: Case 8, anastomosis between right MRA and left SRA; D: Case 1, embolization of the distal branches of the SRA (arrows) and occlusion of the anastomosis with MRA; E: Case 5, embolization of the distal branches of the SRA and occlusion of the anastomosis with IRA and MRA (arrow); F: Case 8, embolization of the distal branches of the SRA (arrow) and occlusion of the anastomosis between right MRA and left SRA. IMA: Inferior mesenteric artery.
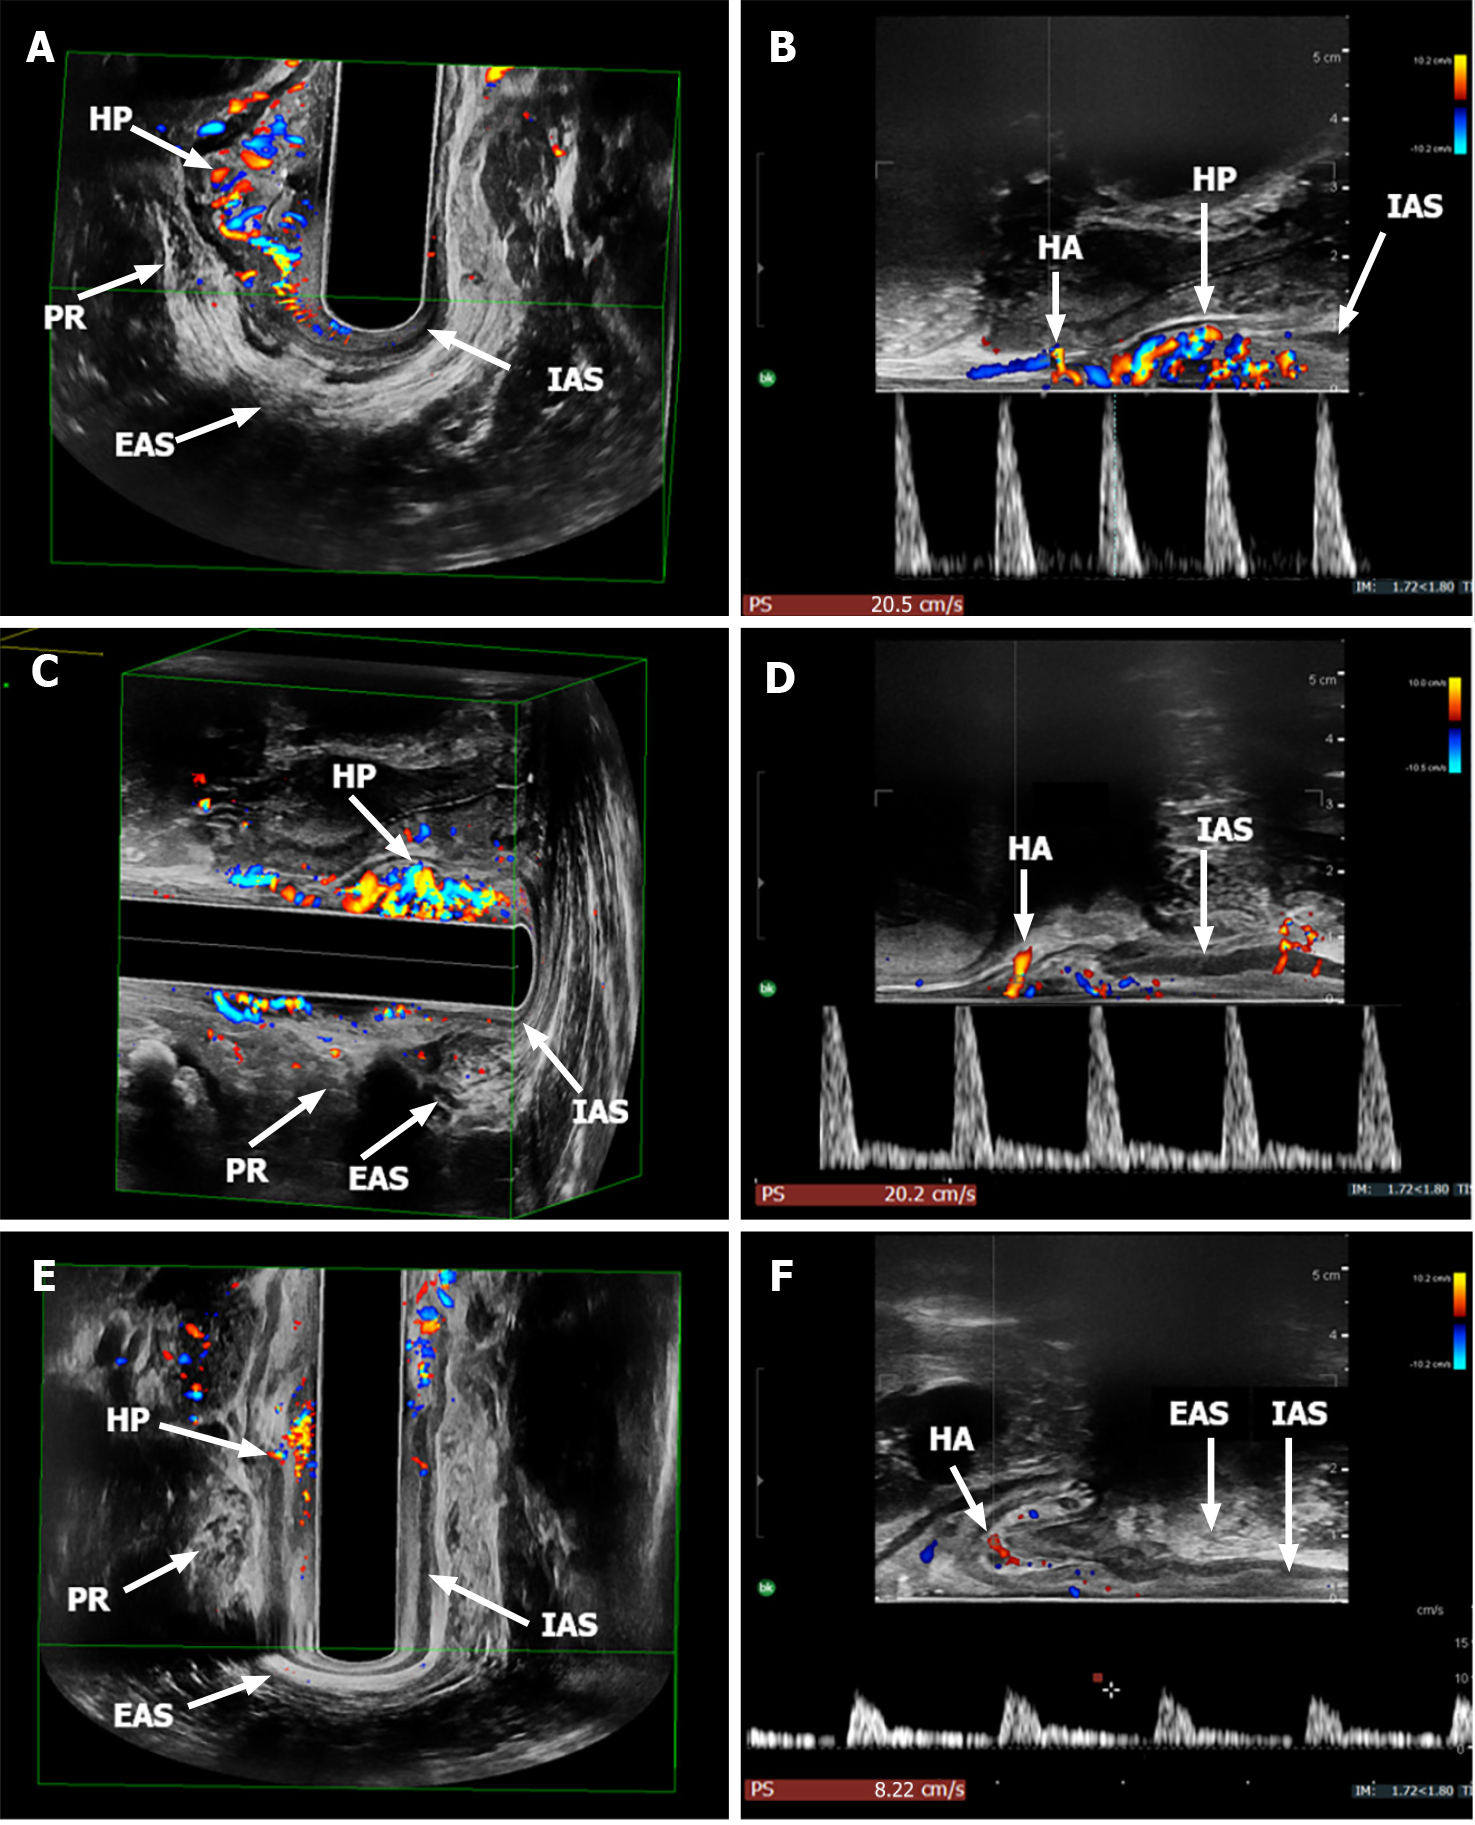
Figure 4 Endoanal ultrasound.
A-D: Preoperative endoanal ultrasound performed by a linear endocavitary transducer (3DX14L4-9038, BK Medical, Herlev, Denmark). Three-dimensional ultrasound with color Doppler showing grade 3 hemorrhoidal plexus (HP) at 11 o’clock position (A); The mean hemorrhoidal artery (HA) systolic peak velocity was 20.5 cm/s (B); Three-dimensional ultrasound with color Doppler showing grade 3 HP at 1 o’clock position (C); and the mean HA systolic peak velocity was 20.2 cm/s (D); E and F: Endoanal ultrasound at 1-mo follow-up. Three-dimensional ultrasound with color Doppler showing the regression of HP at 11 o’clock position (E); and the reduction of the mean HA systolic peak velocity (8.22 cm/s) (F, same case of Figure A and B). EAS: External anal sphincter; IAS: Internal anal sphincter; PR: Puborectalis muscle.
Figure 5 Mean systolic peak.
A: Pre- and post-treatment mean systolic peak (MSP, cm/s) changes; B: Overall pre- and post-treatment MSP (cm/s).
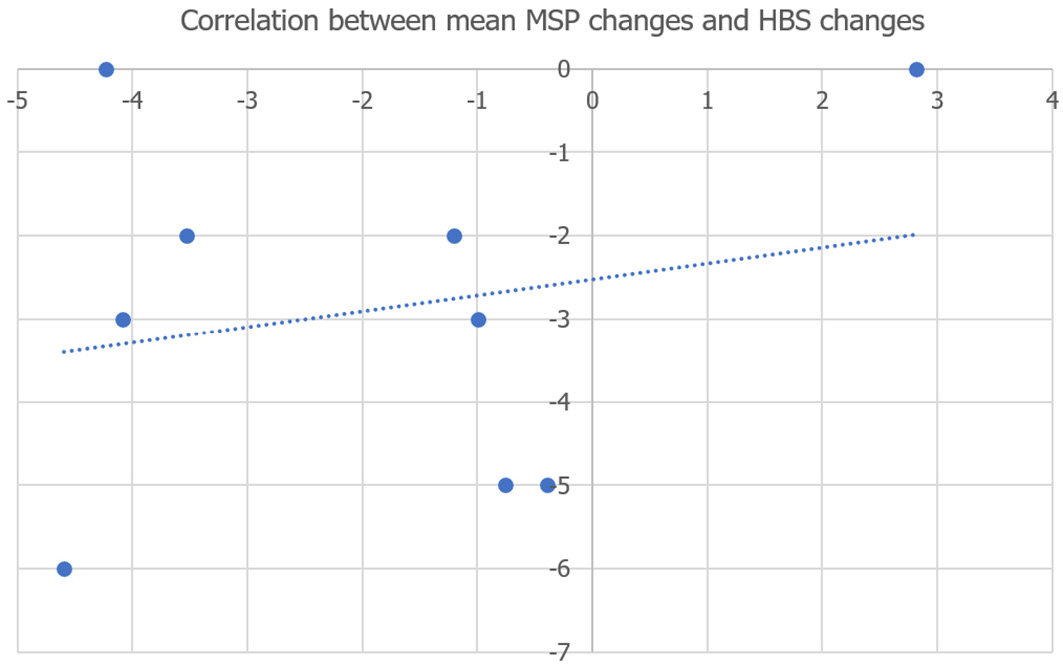
Figure 6 Scatterplot of the correlation between mean systolic peak and hemorrhoidal bleeding score change.
HBS: Hemorrhoidal bleeding score; MSP: Mean systolic peak.
- Citation: Tutino R, Stecca T, Farneti F, Massani M, Santoro GA. Transanal eco-Doppler evaluation after hemorrhoidal artery embolization. World J Gastroenterol 2024; 30(17): 2332-2342
- URL: https://www.wjgnet.com/1007-9327/full/v30/i17/2332.htm
- DOI: https://dx.doi.org/10.3748/wjg.v30.i17.2332


