Copyright
©The Author(s) 2020.
World J Gastroenterol. Feb 7, 2020; 26(5): 514-523
Published online Feb 7, 2020. doi: 10.3748/wjg.v26.i5.514
Published online Feb 7, 2020. doi: 10.3748/wjg.v26.i5.514
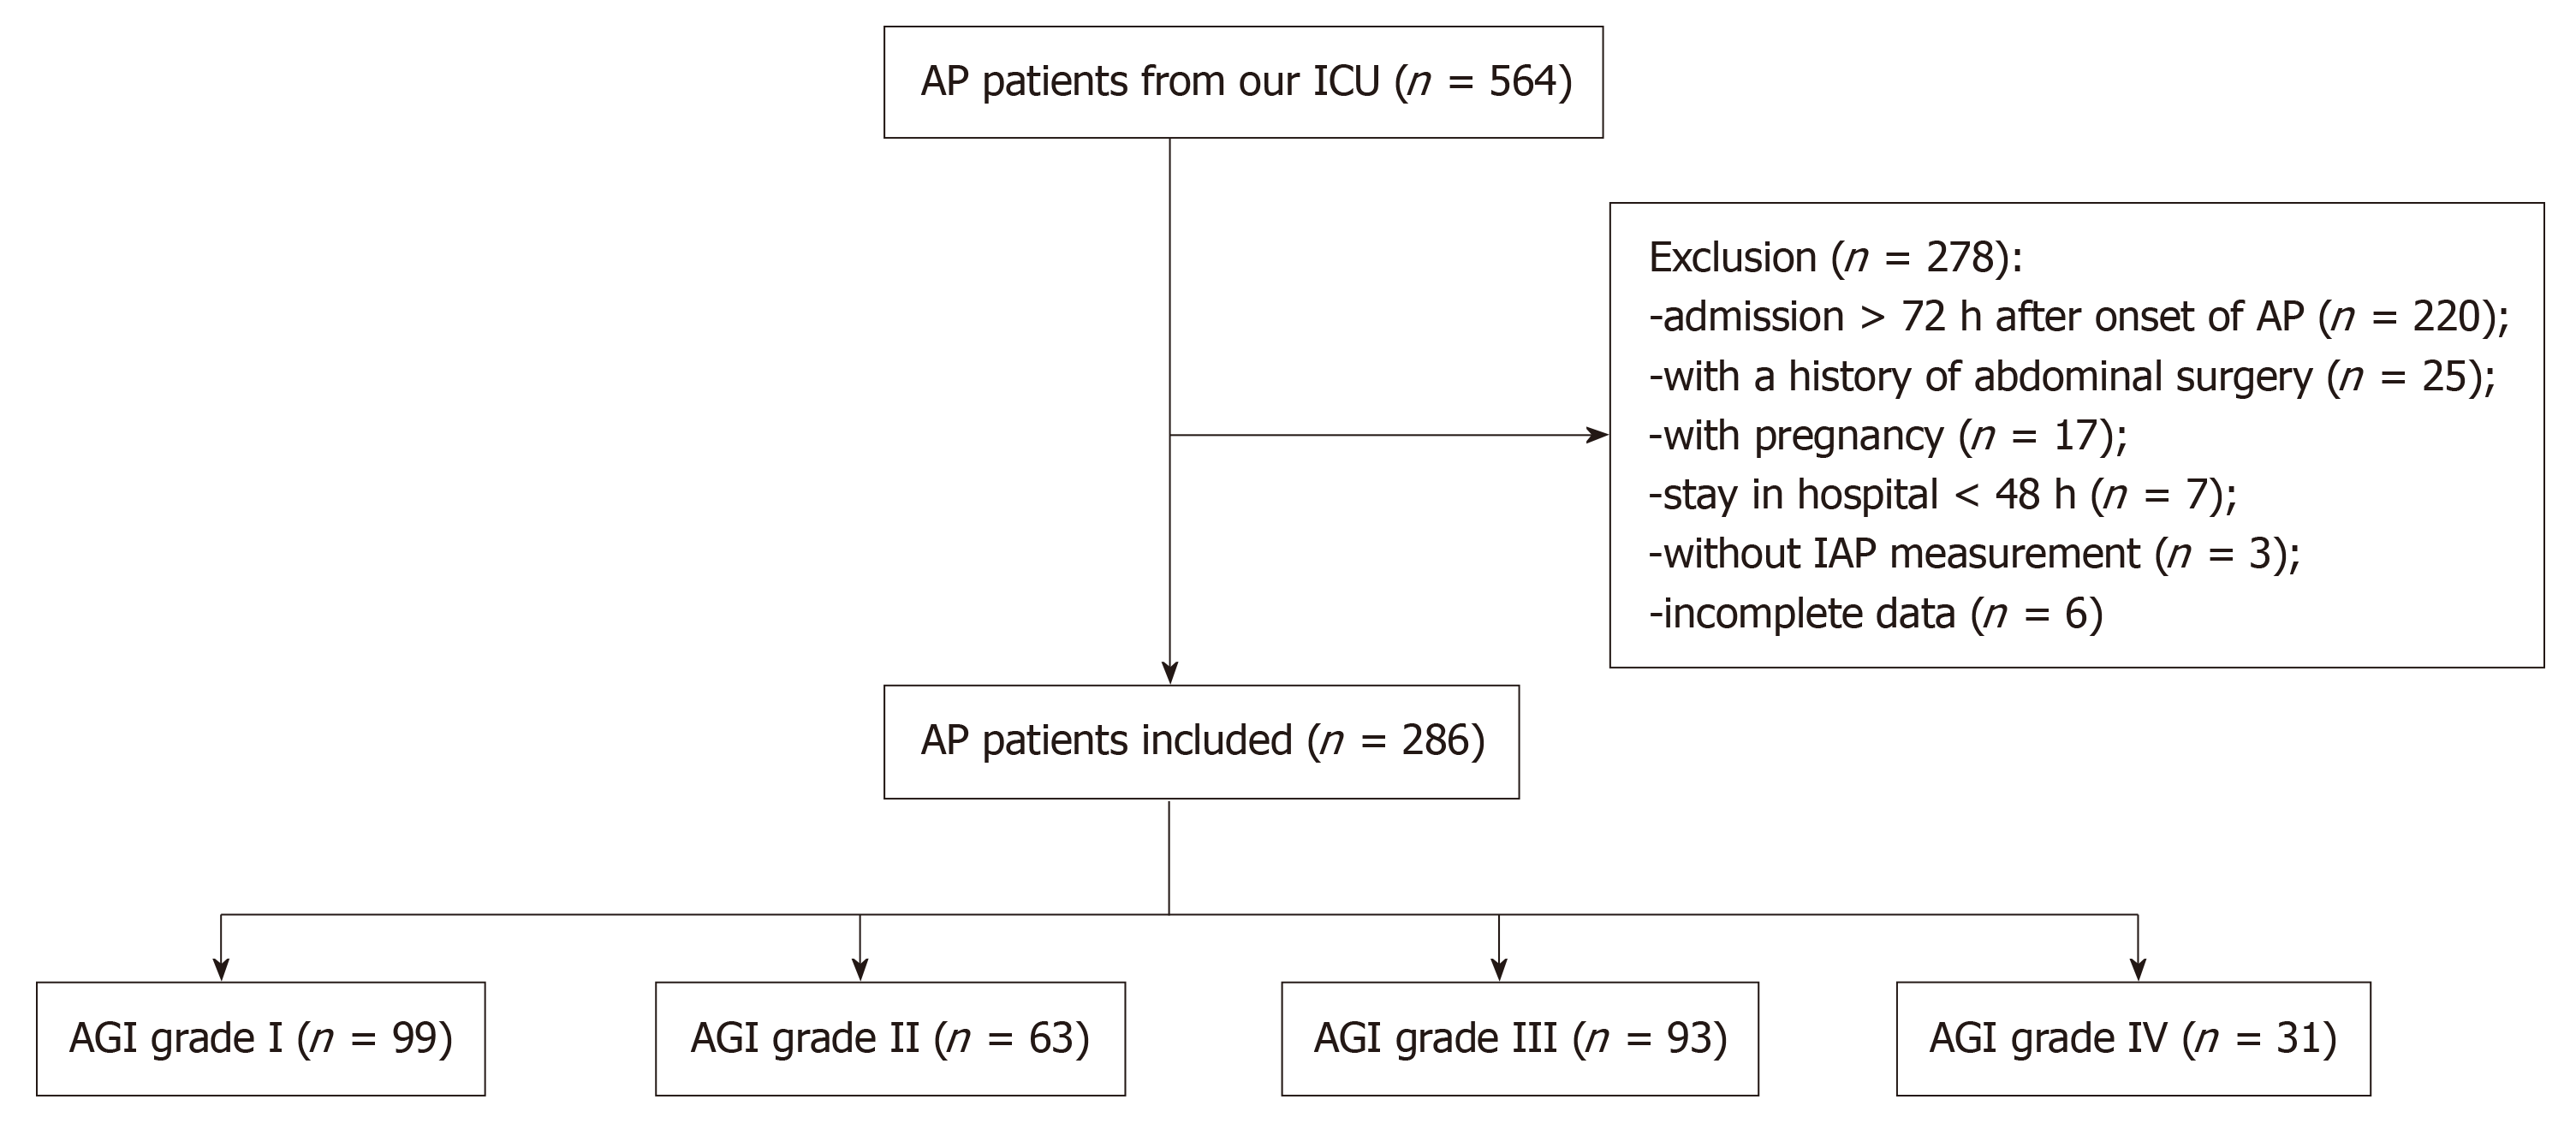
Figure 1 Flow chart of acute pancreatitis patients with acute gastrointestinal injury.
AP: Acute pancreatitis; ICU: Intensive care unit; IAP: Intra-abdominal pressure; AGI: Acute gastrointestinal injury.
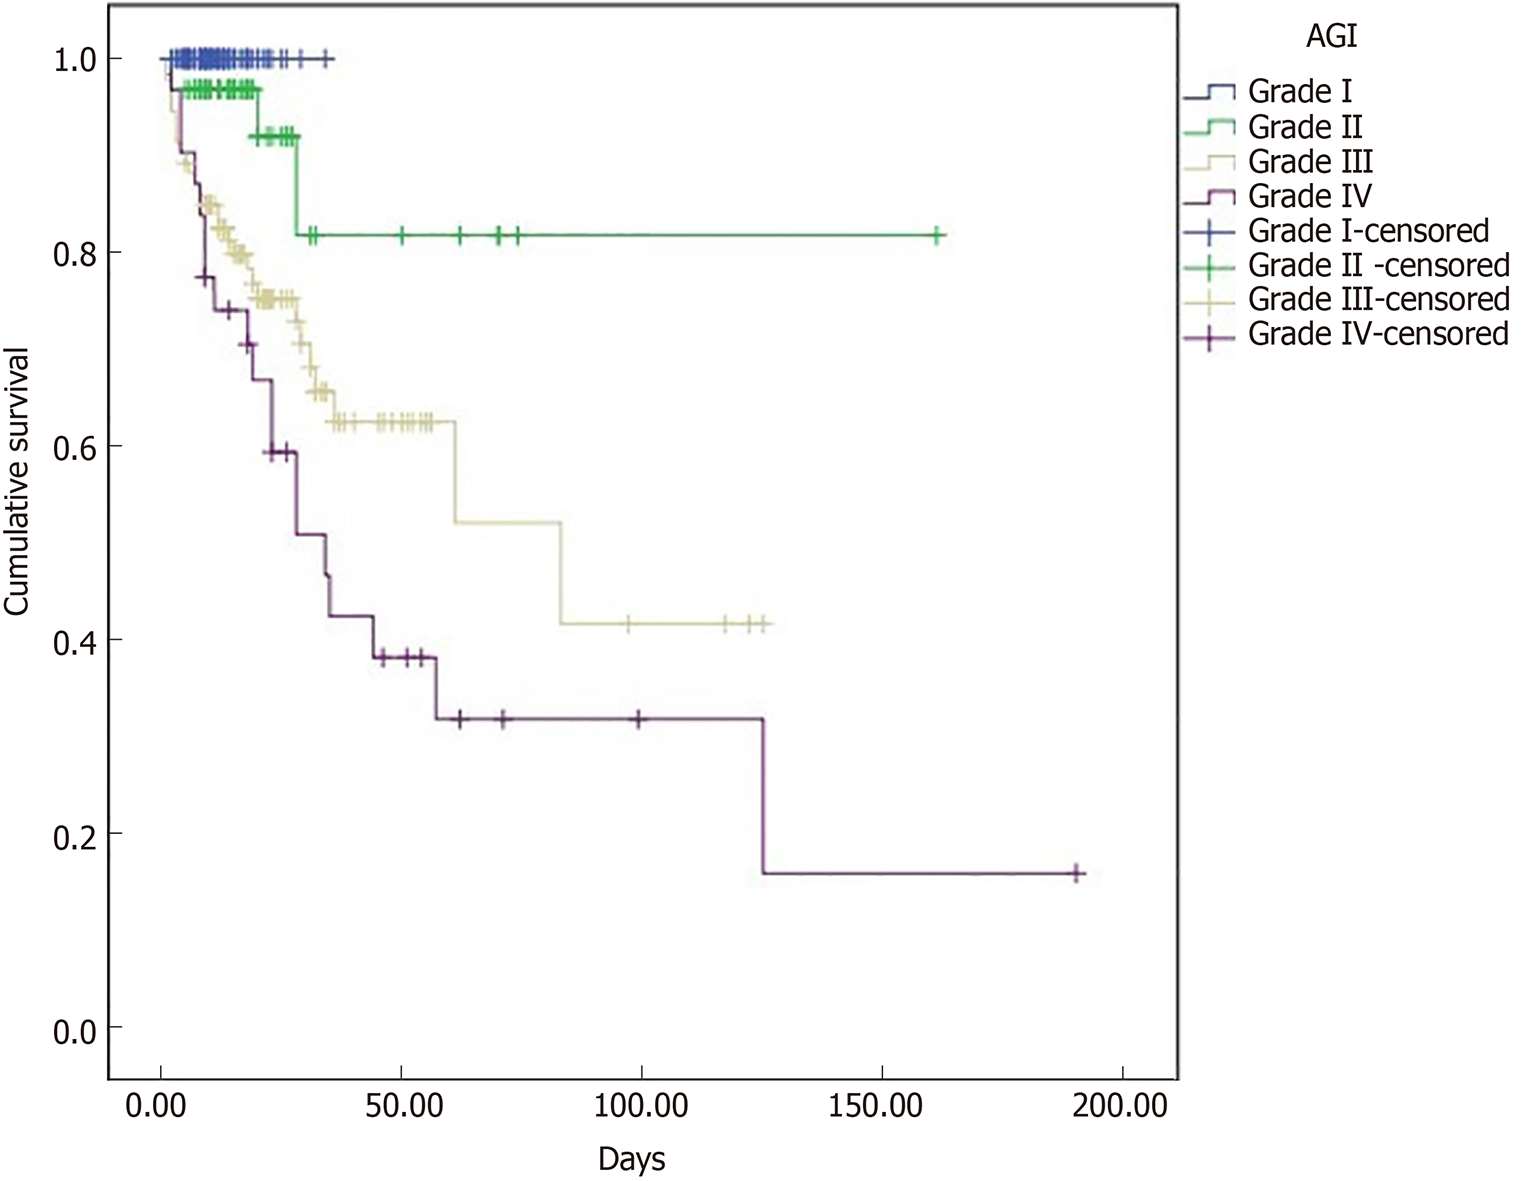
Figure 2 Kaplan-Meier analysis stratified on the basis of global acute gastrointestinal injury grade.
AGI: Acute gastrointestinal injury.
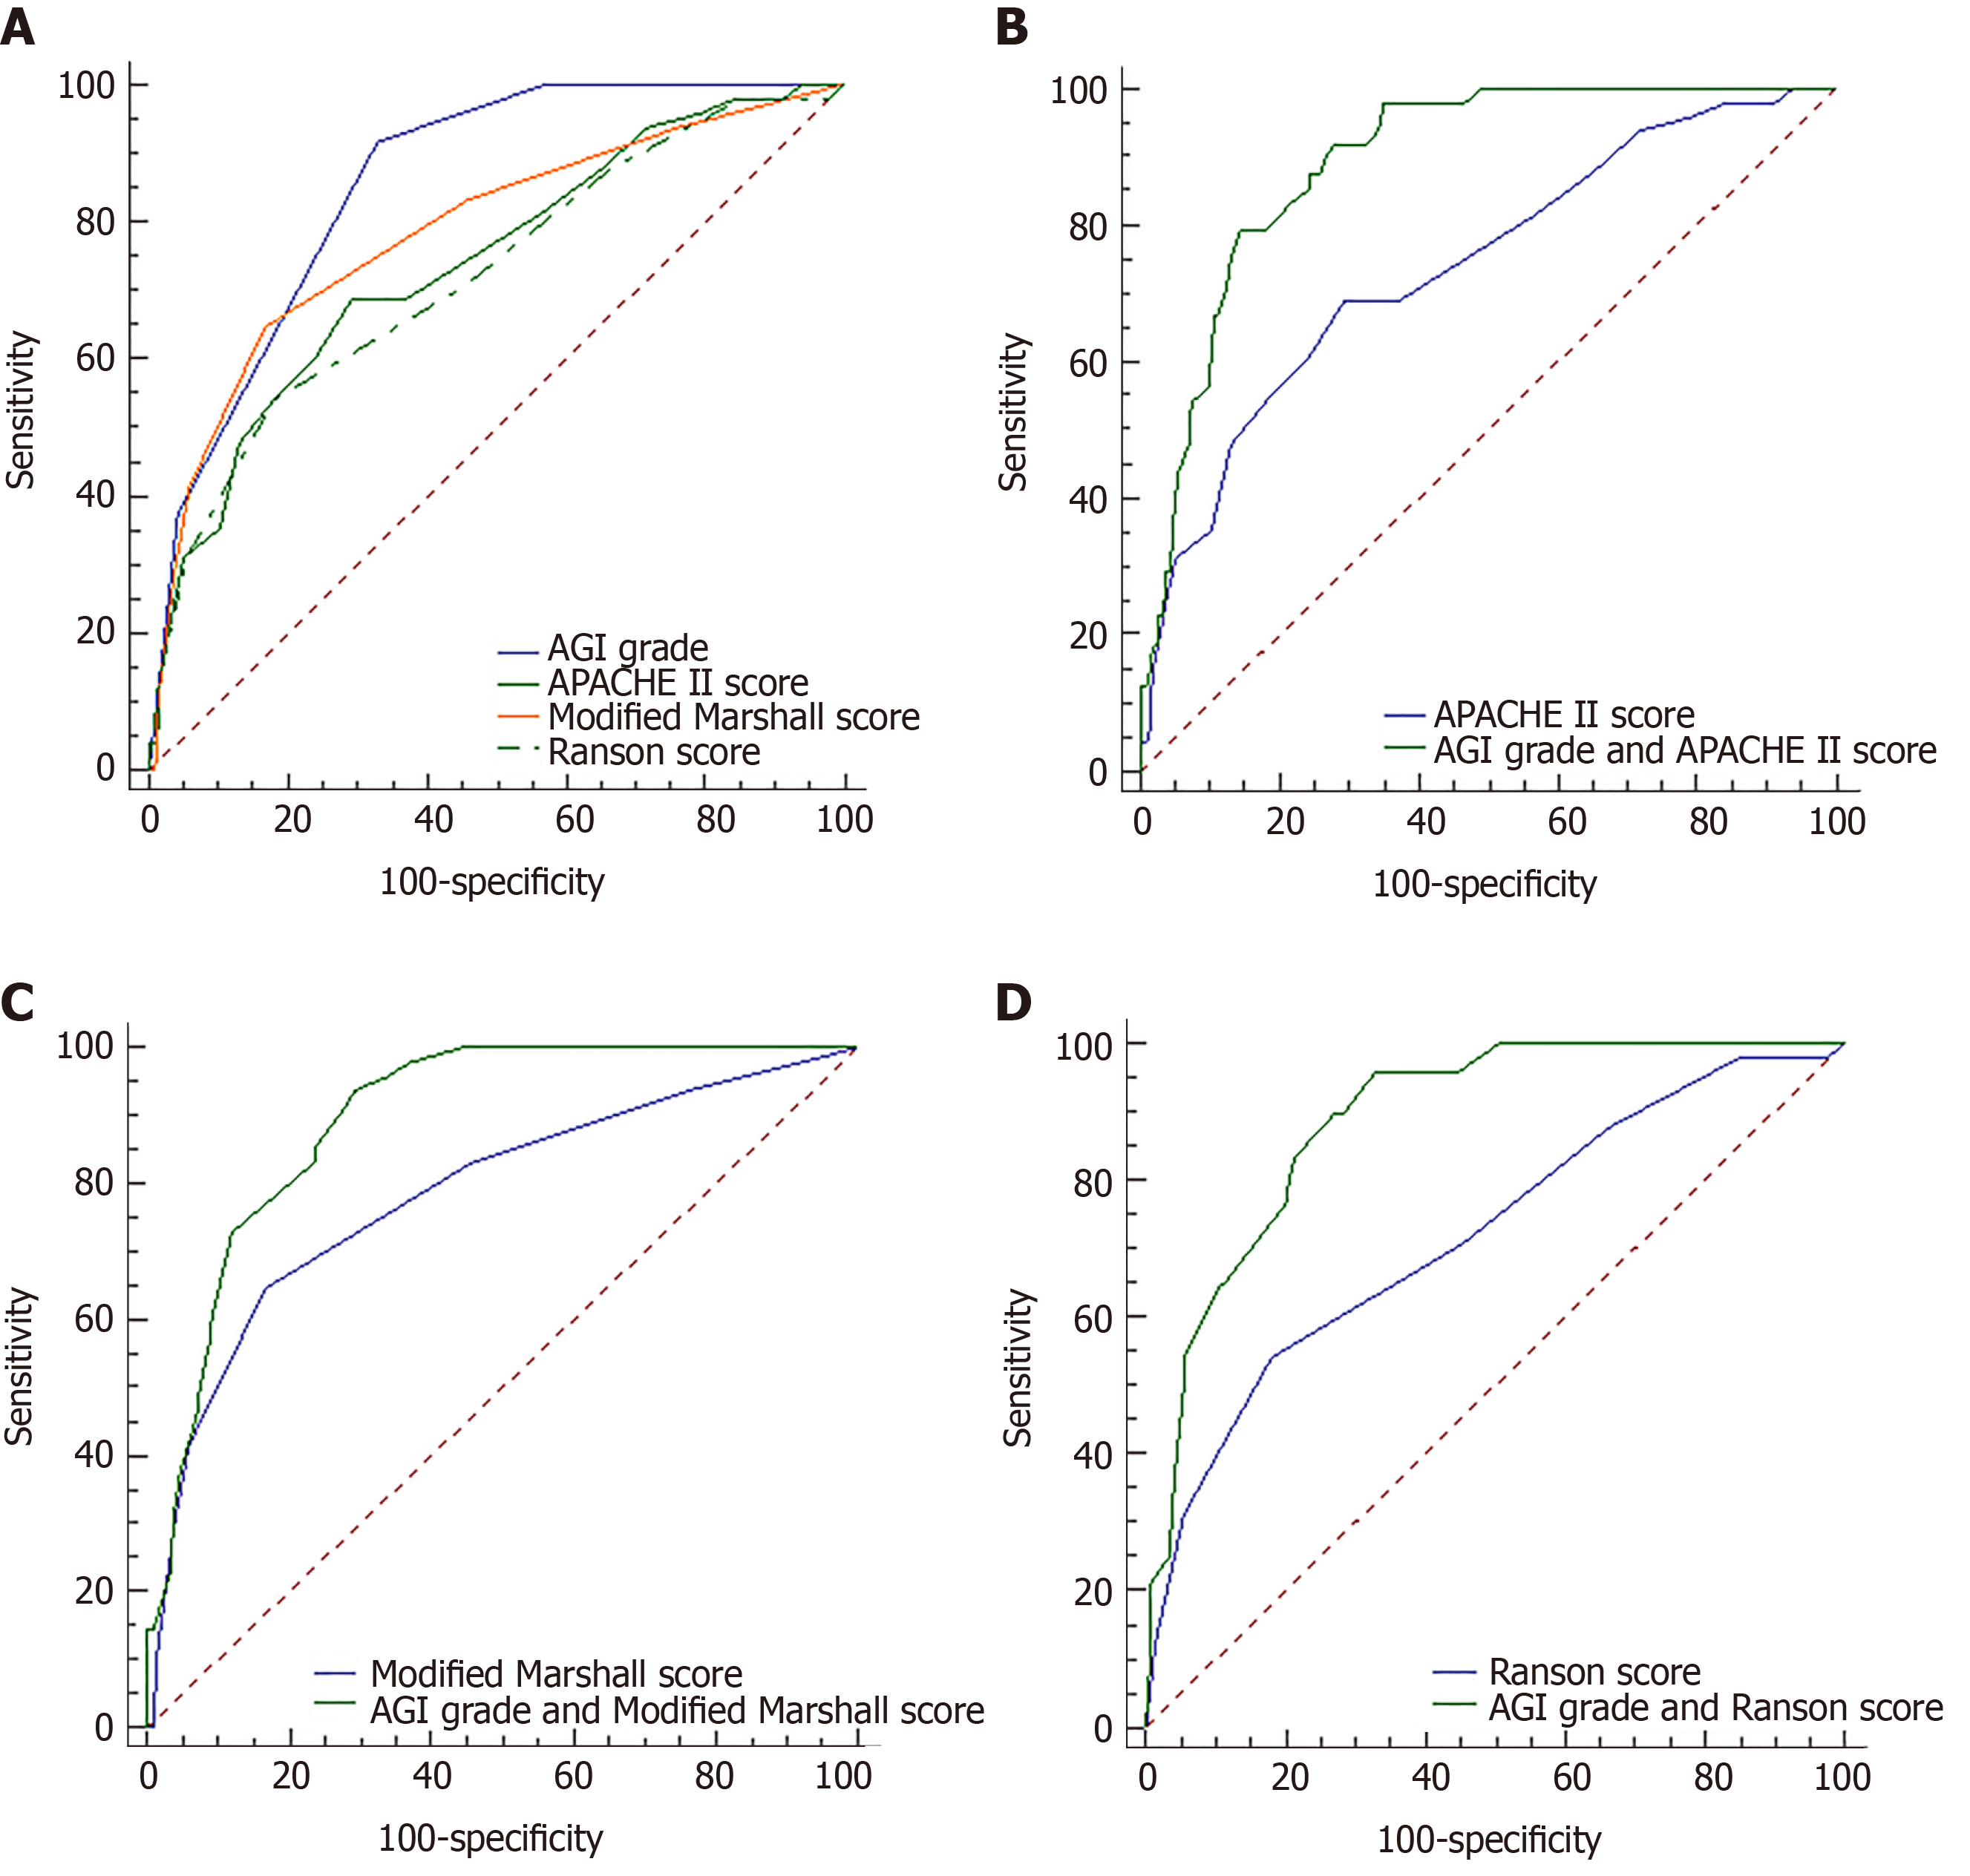
Figure 3 Receiver operating characteristic curve analysis of scores for predicting mortality in acute pancreatitis patients in the intensive care unit.
A: Receiver operating characteristic (ROC) curve analysis of acute gastrointestinal injury (AGI) grade [area under curve (AUC): 0.854], Acute Physiology and Chronic Health Evaluation (APACHE) II score (AUC: 0.739), Modified Marshall score (AUC: 0.785), and Ranson score (AUC: 0.72) for predicting mortality; B: ROC curve analysis of AGI grade + APACHE II score (AUC: 0.893) and APACHE II score (AUC: 0.739) for predicting mortality; C: ROC curve analysis of AGI grade + Modified Marshall score (AUC: 0.895) and Modified Marshall score (AUC: 0.785) for predicting mortality; D: ROC curve analysis of AGI grade + Ranson score (AUC: 0.89) and Ranson score (AUC: 0.72) for predicting mortality. AGI: Acute gastrointestinal injury; APACHE: Acute Physiology and Chronic Health Evaluation.
- Citation: Ding L, Chen HY, Wang JY, Xiong HF, He WH, Xia L, Lu NH, Zhu Y. Severity of acute gastrointestinal injury grade is a good predictor of mortality in critically ill patients with acute pancreatitis. World J Gastroenterol 2020; 26(5): 514-523
- URL: https://www.wjgnet.com/1007-9327/full/v26/i5/514.htm
- DOI: https://dx.doi.org/10.3748/wjg.v26.i5.514


