Copyright
©The Author(s) 2019.
World J Gastroenterol. Jun 28, 2019; 25(24): 3021-3029
Published online Jun 28, 2019. doi: 10.3748/wjg.v25.i24.3021
Published online Jun 28, 2019. doi: 10.3748/wjg.v25.i24.3021
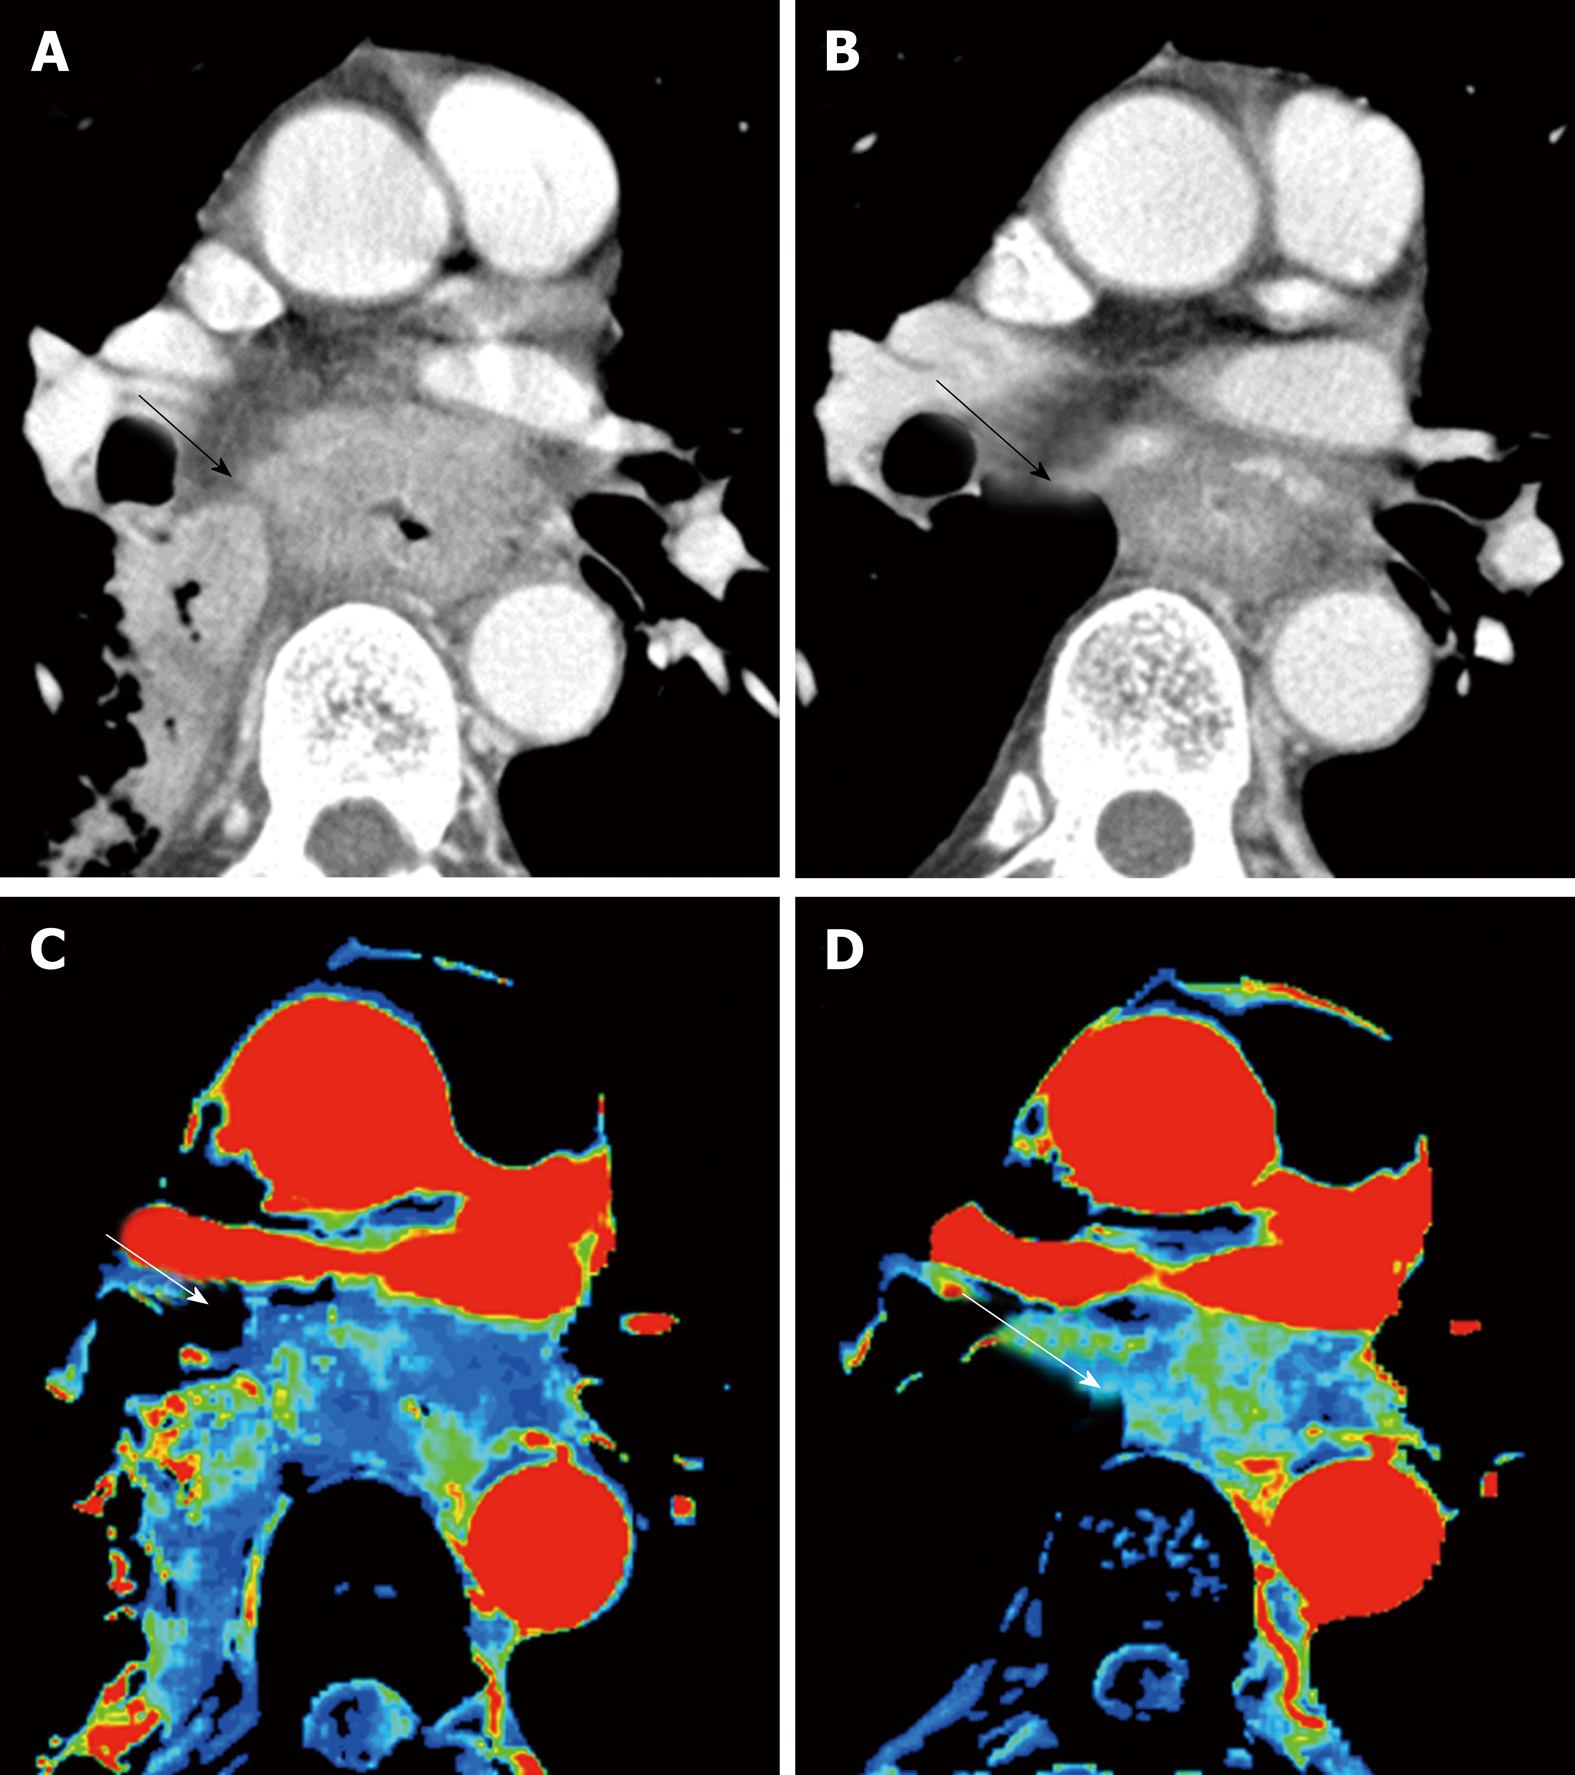
Figure 1 Perfusion change of esophageal cancer during chemoradiation therapy.
A: Computed tomography (CT) image at baseline; B: CT image at post-chemoradiation therapy (CRT); C: Blood flow map by CT perfusion at baseline; D: Blood flow map at post-CRT. Baseline blood flow of this tumor was low, and this patient was diagnosed as no-responder. CRT: Chemoradiation therapy; CT: Computed tomography.
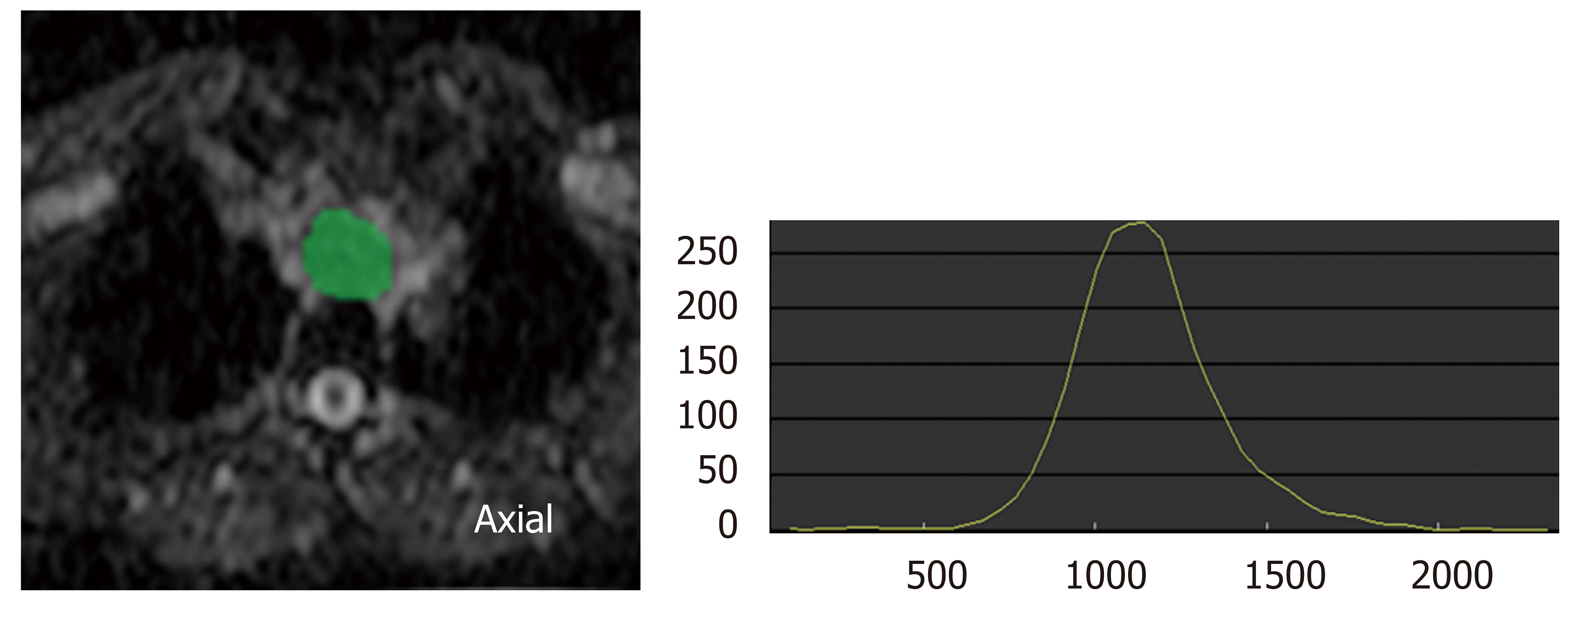
Figure 2 Histogram analysis of diffusion-weighted imaging.
Histogram analysis is one of the texture analyses. This is the histogram analysis of apparent diffusion coefficient (ADC) map. Region of interest (ROI) for the tumor is drawn on ADC map, and distribution of pixels in the ROI is quantified as histogram parameters such as kurtosis and skewness. ADC: Apparent diffusion coefficient; ROI: Region of interest.
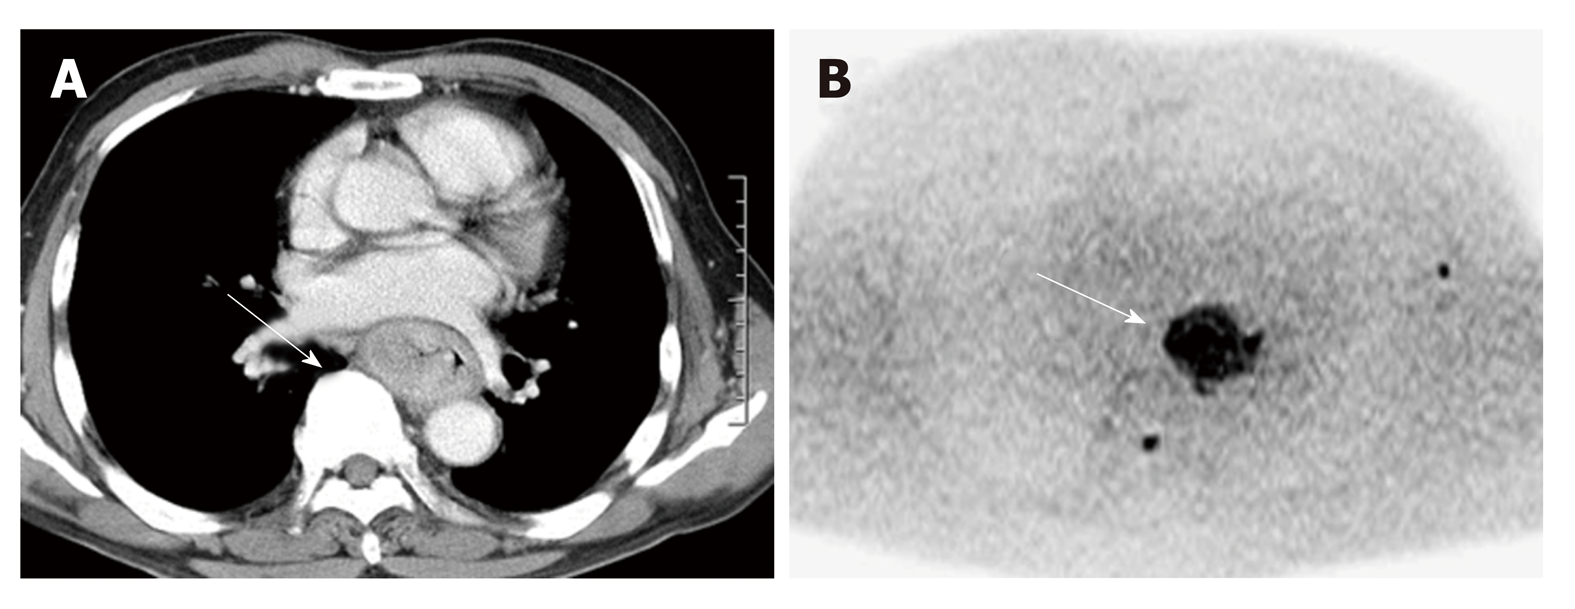
Figure 3 Advanced esophageal squamous cell carcinoma in contrast enhanced computed tomography image and diffusion-weighted imaging at b = 1000.
A: Contrast enhanced computed tomography image; B: Diffusion-weighted imaging. The tumor showed conspicuous high signal intensity on high b-value diffusion-weighted imaging.
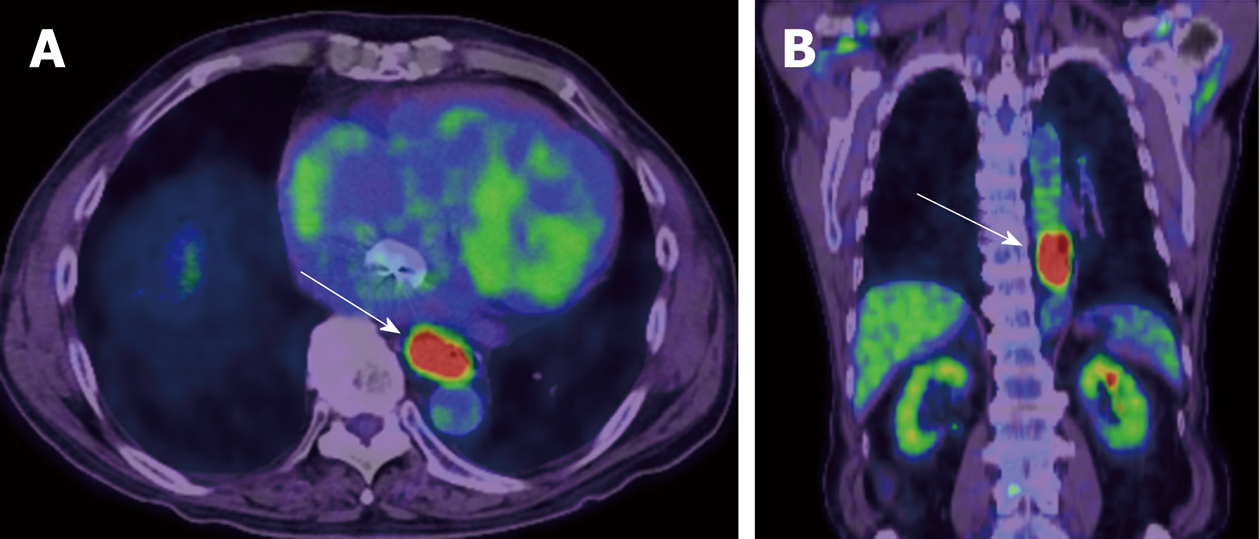
Figure 4 18F-fluorodeoxyglucose positron emission tomography image of esophageal cancer.
A: Axial image; B: Coronal image. Malignancies exhibit strongly enhanced energy consumption, resulting in increased 18F-fluorodeoxyglucose uptake.
- Citation: Hayano K, Ohira G, Hirata A, Aoyagi T, Imanishi S, Tochigi T, Hanaoka T, Shuto K, Matsubara H. Imaging biomarkers for the treatment of esophageal cancer. World J Gastroenterol 2019; 25(24): 3021-3029
- URL: https://www.wjgnet.com/1007-9327/full/v25/i24/3021.htm
- DOI: https://dx.doi.org/10.3748/wjg.v25.i24.3021


