Copyright
©The Author(s) 2019.
World J Gastroenterol. Jun 28, 2019; 25(24): 3021-3029
Published online Jun 28, 2019. doi: 10.3748/wjg.v25.i24.3021
Published online Jun 28, 2019. doi: 10.3748/wjg.v25.i24.3021
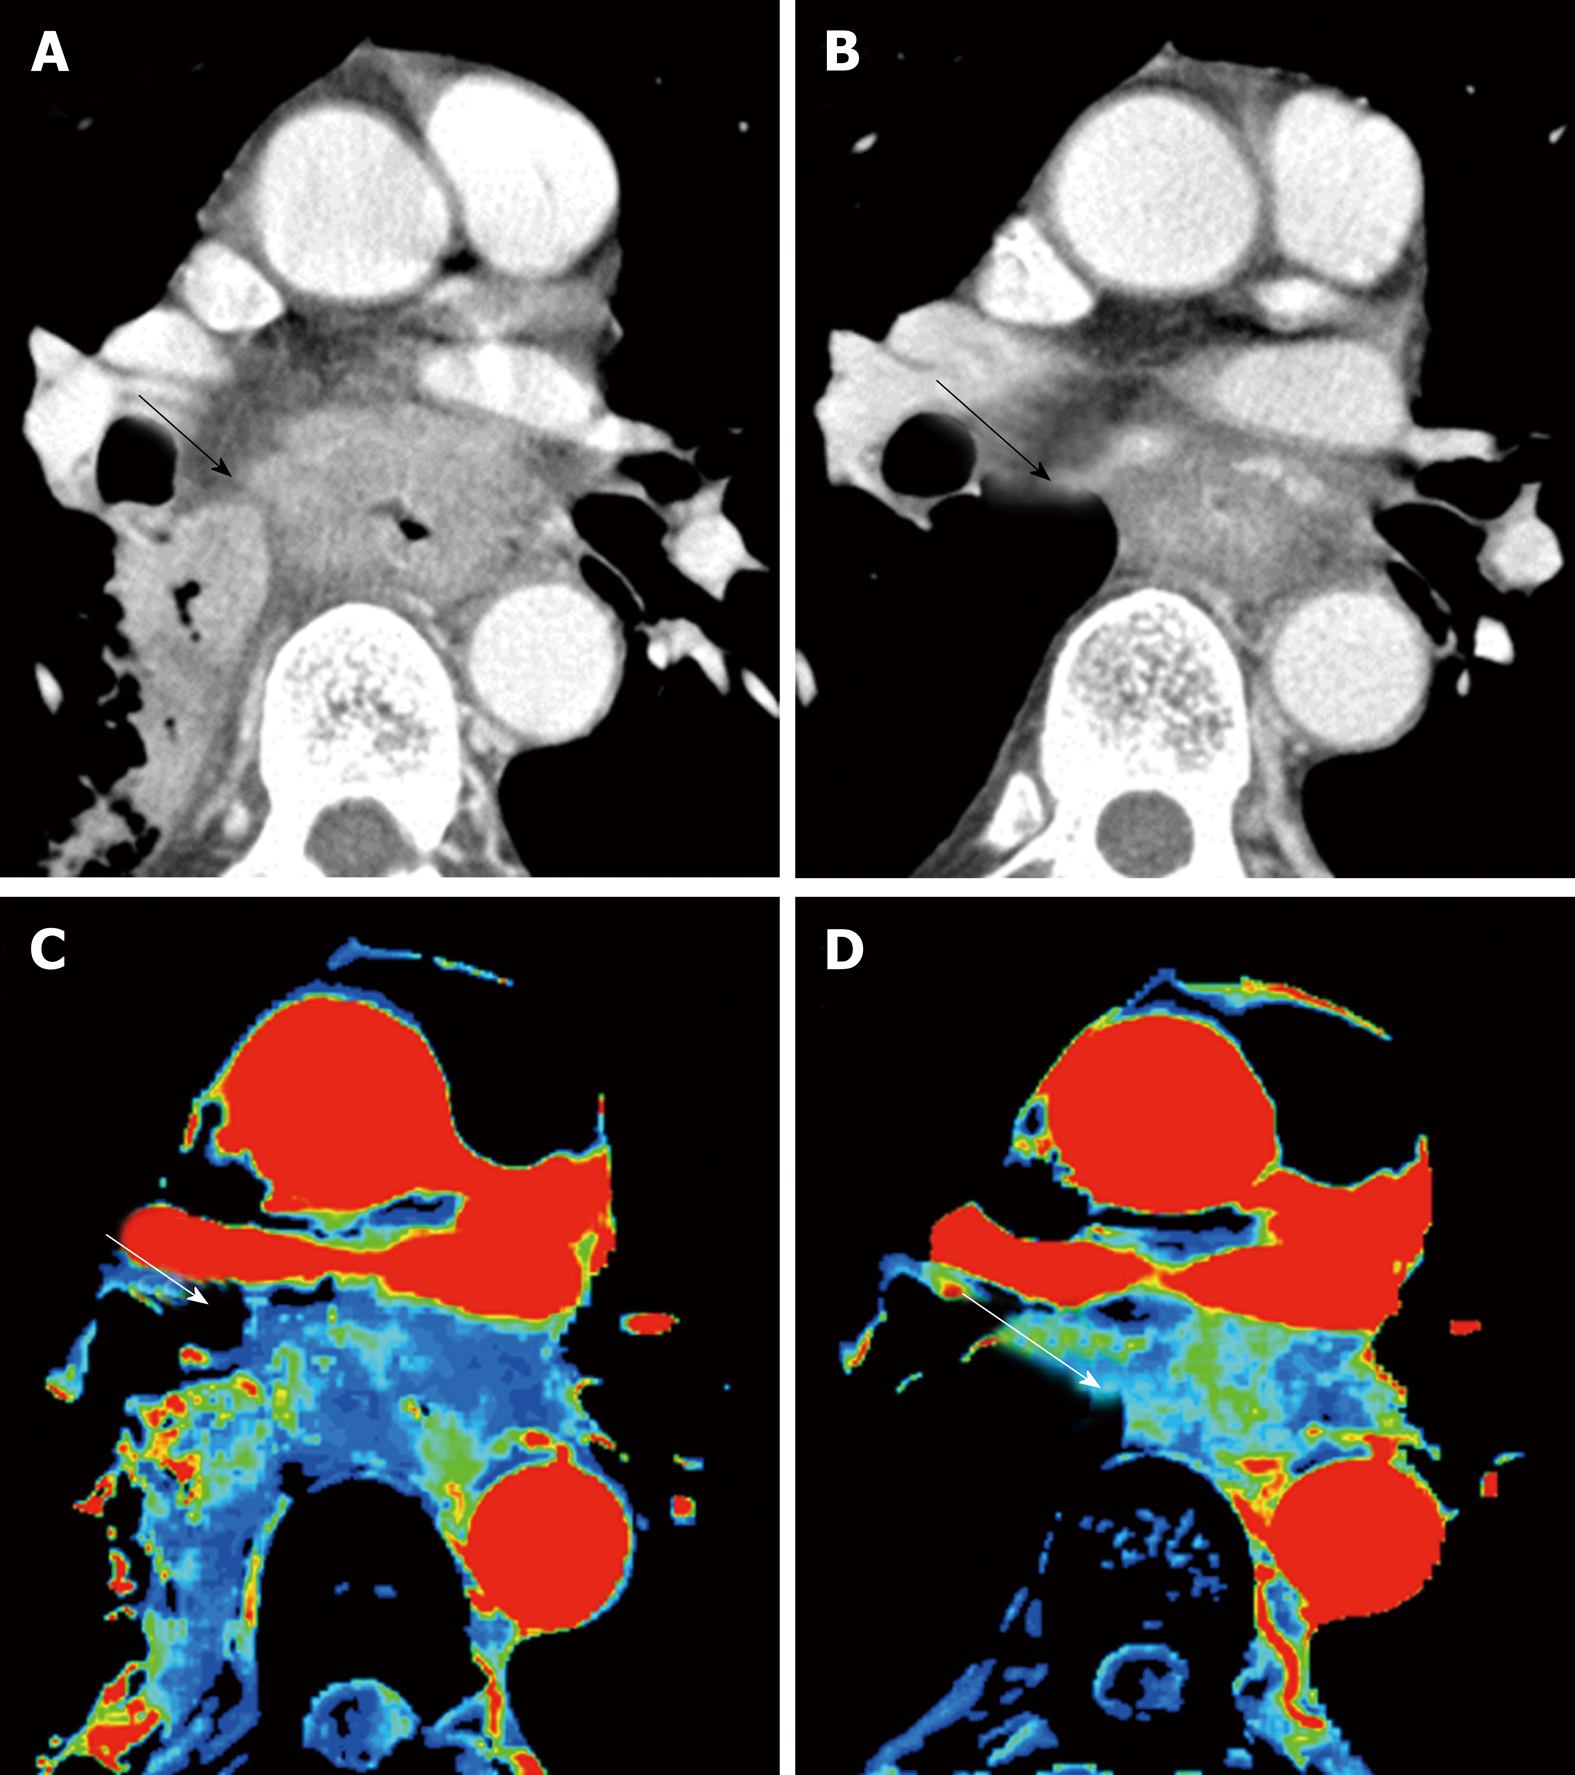
Figure 1 Perfusion change of esophageal cancer during chemoradiation therapy.
A: Computed tomography (CT) image at baseline; B: CT image at post-chemoradiation therapy (CRT); C: Blood flow map by CT perfusion at baseline; D: Blood flow map at post-CRT. Baseline blood flow of this tumor was low, and this patient was diagnosed as no-responder. CRT: Chemoradiation therapy; CT: Computed tomography.
- Citation: Hayano K, Ohira G, Hirata A, Aoyagi T, Imanishi S, Tochigi T, Hanaoka T, Shuto K, Matsubara H. Imaging biomarkers for the treatment of esophageal cancer. World J Gastroenterol 2019; 25(24): 3021-3029
- URL: https://www.wjgnet.com/1007-9327/full/v25/i24/3021.htm
- DOI: https://dx.doi.org/10.3748/wjg.v25.i24.3021


