Copyright
©The Author(s) 2019.
World J Gastroenterol. Jun 21, 2019; 25(23): 2935-2946
Published online Jun 21, 2019. doi: 10.3748/wjg.v25.i23.2935
Published online Jun 21, 2019. doi: 10.3748/wjg.v25.i23.2935
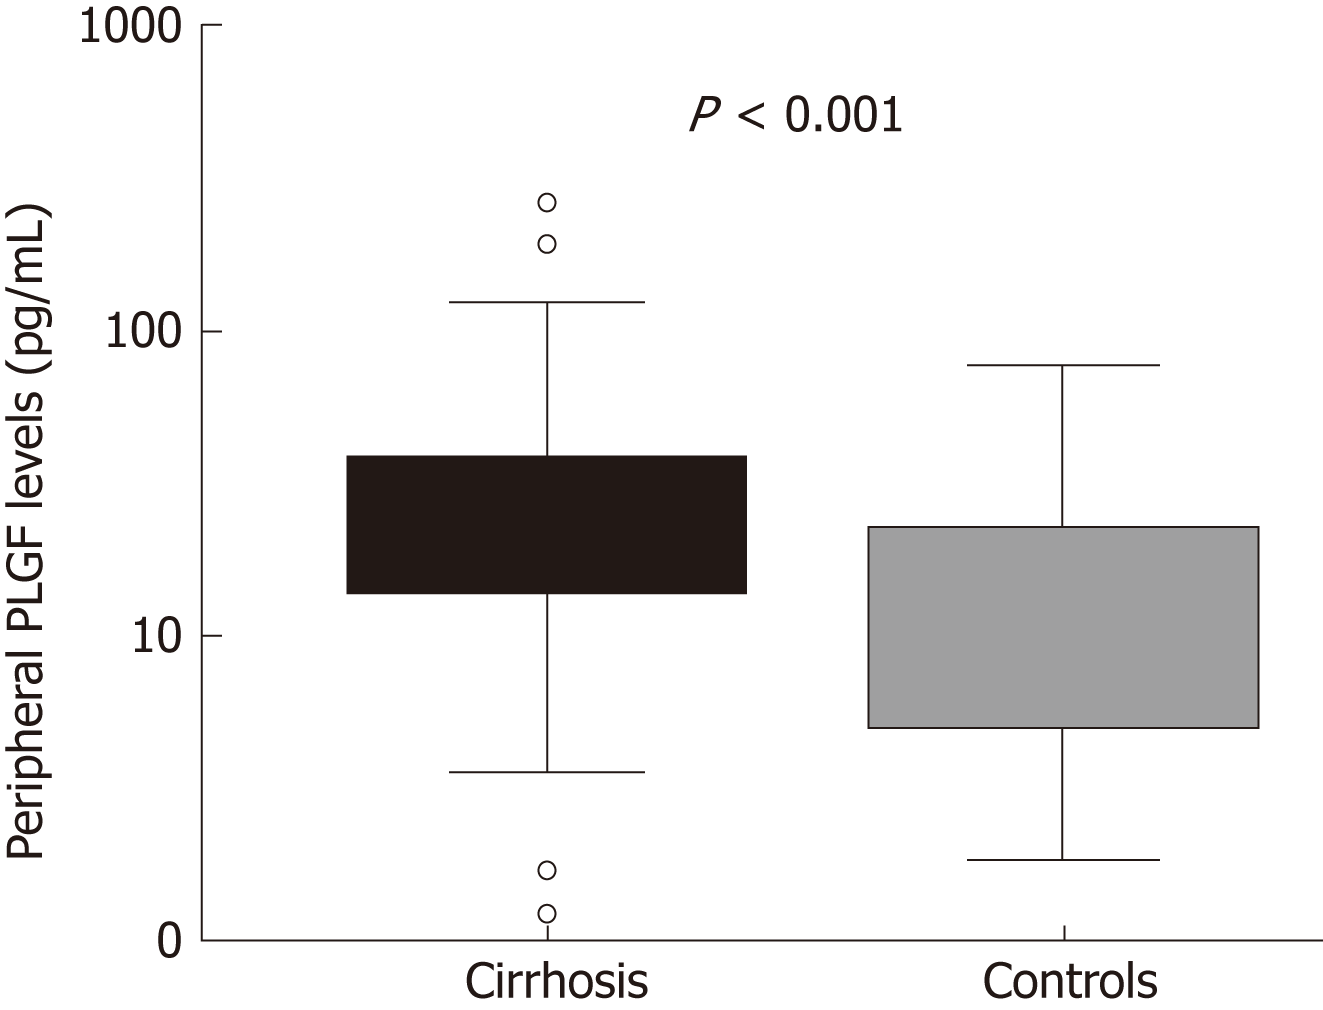
Figure 1 Peripheral placental growth factor levels in liver cirrhosis and controls.
Box plot graph; boxes correspond to the median value and interquartile range. PlGF: Placental growth factor.
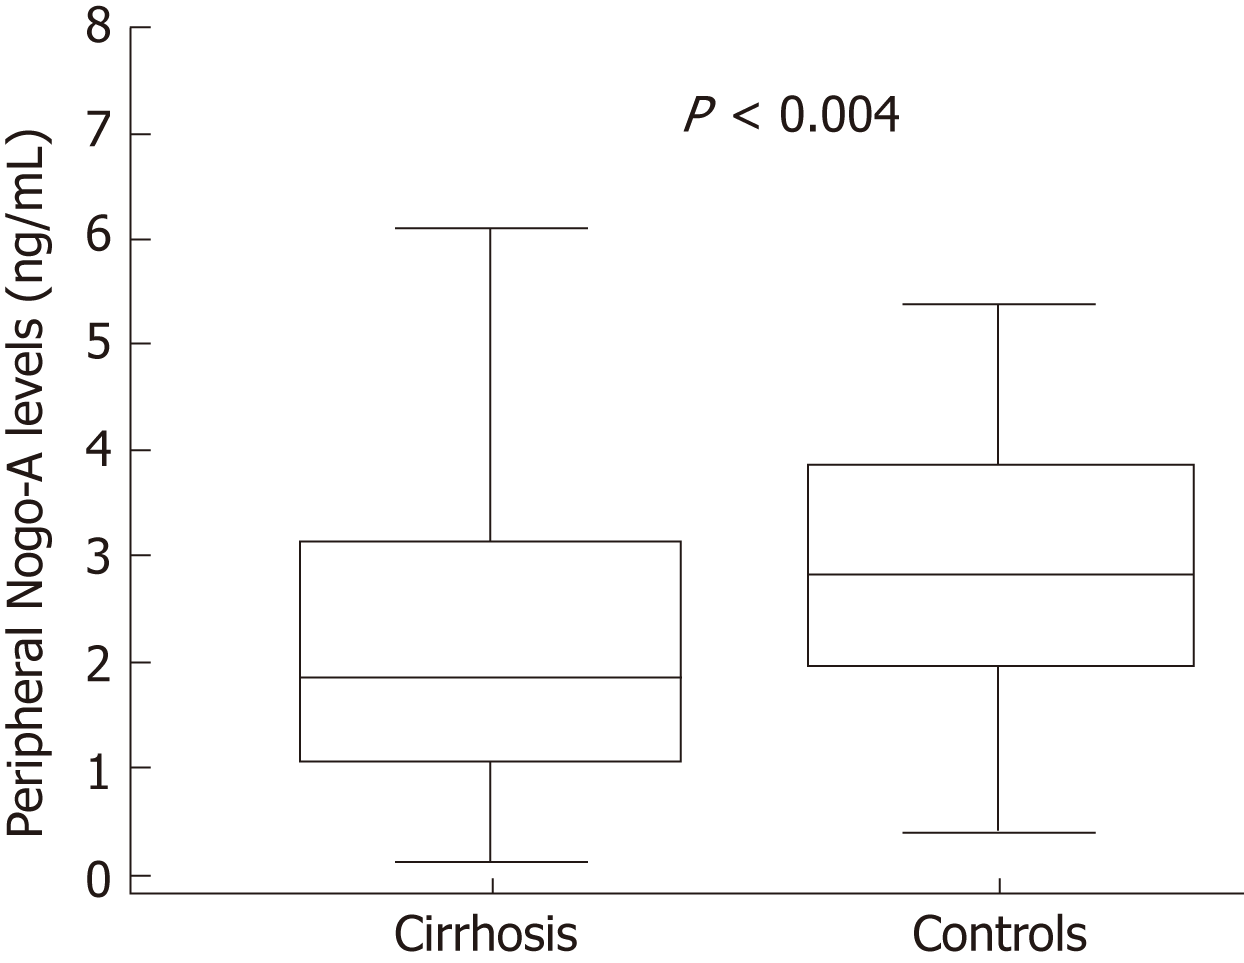
Figure 2 Peripheral Nogo-A levels in liver cirrhosis and controls.
Box plot graph; boxes correspond to the mean value and standard deviation.
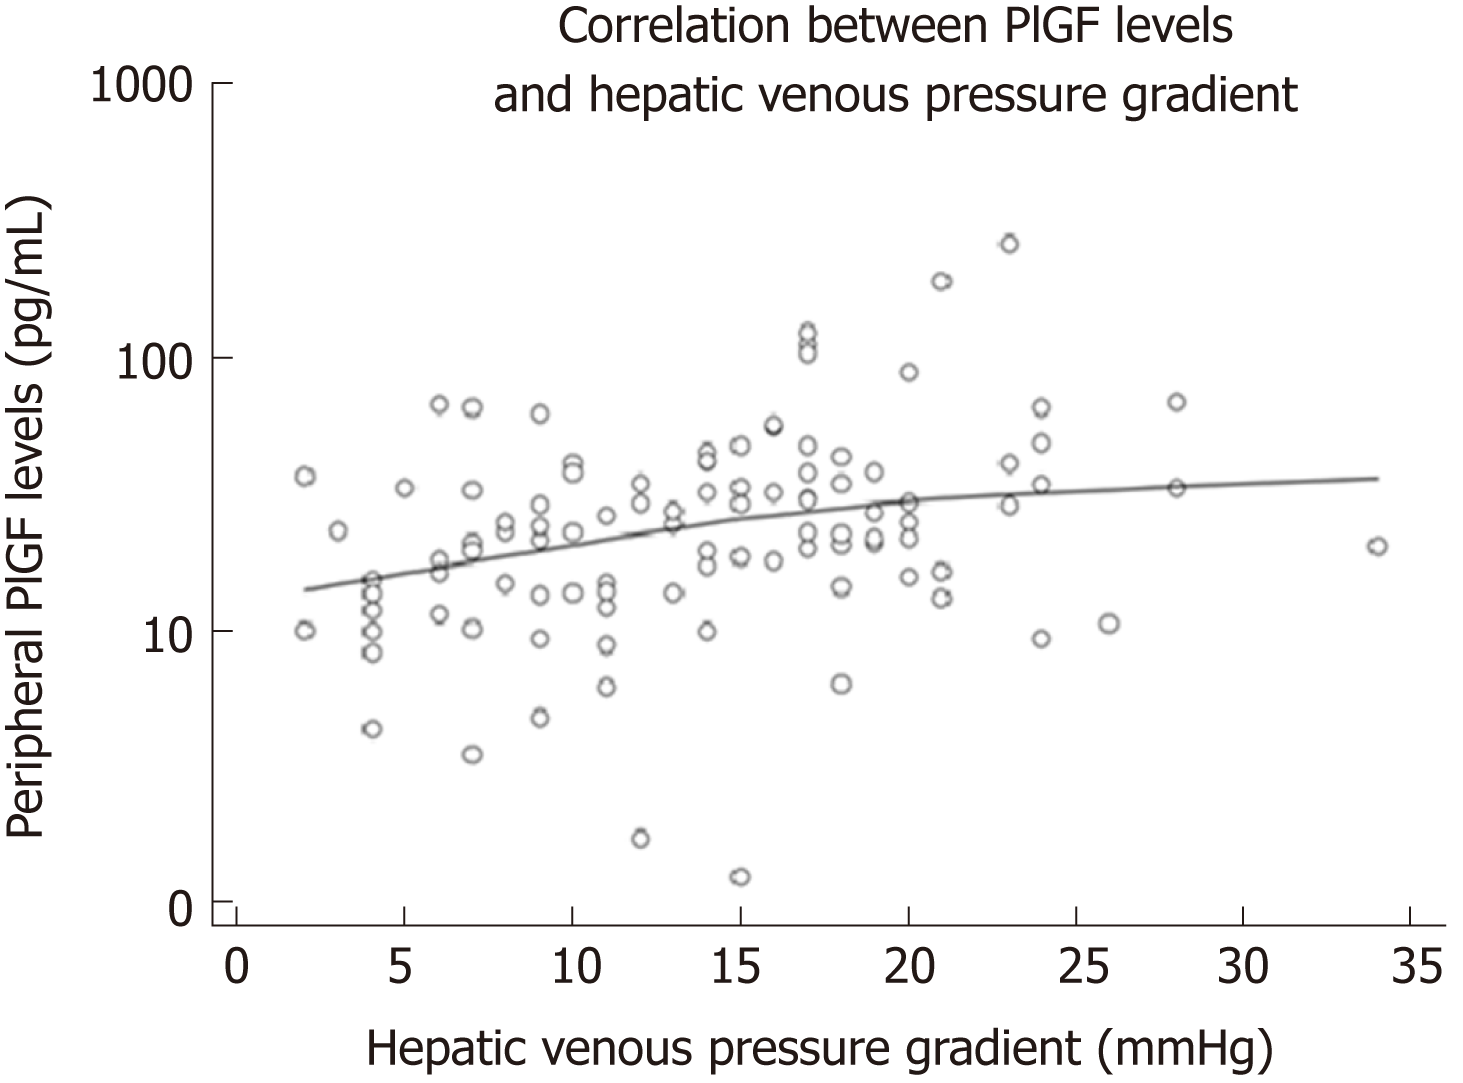
Figure 3 Relationship between peripheral placental growth factor levels and hepatic venous pressure gradient.
PlGF: Placental growth factor.
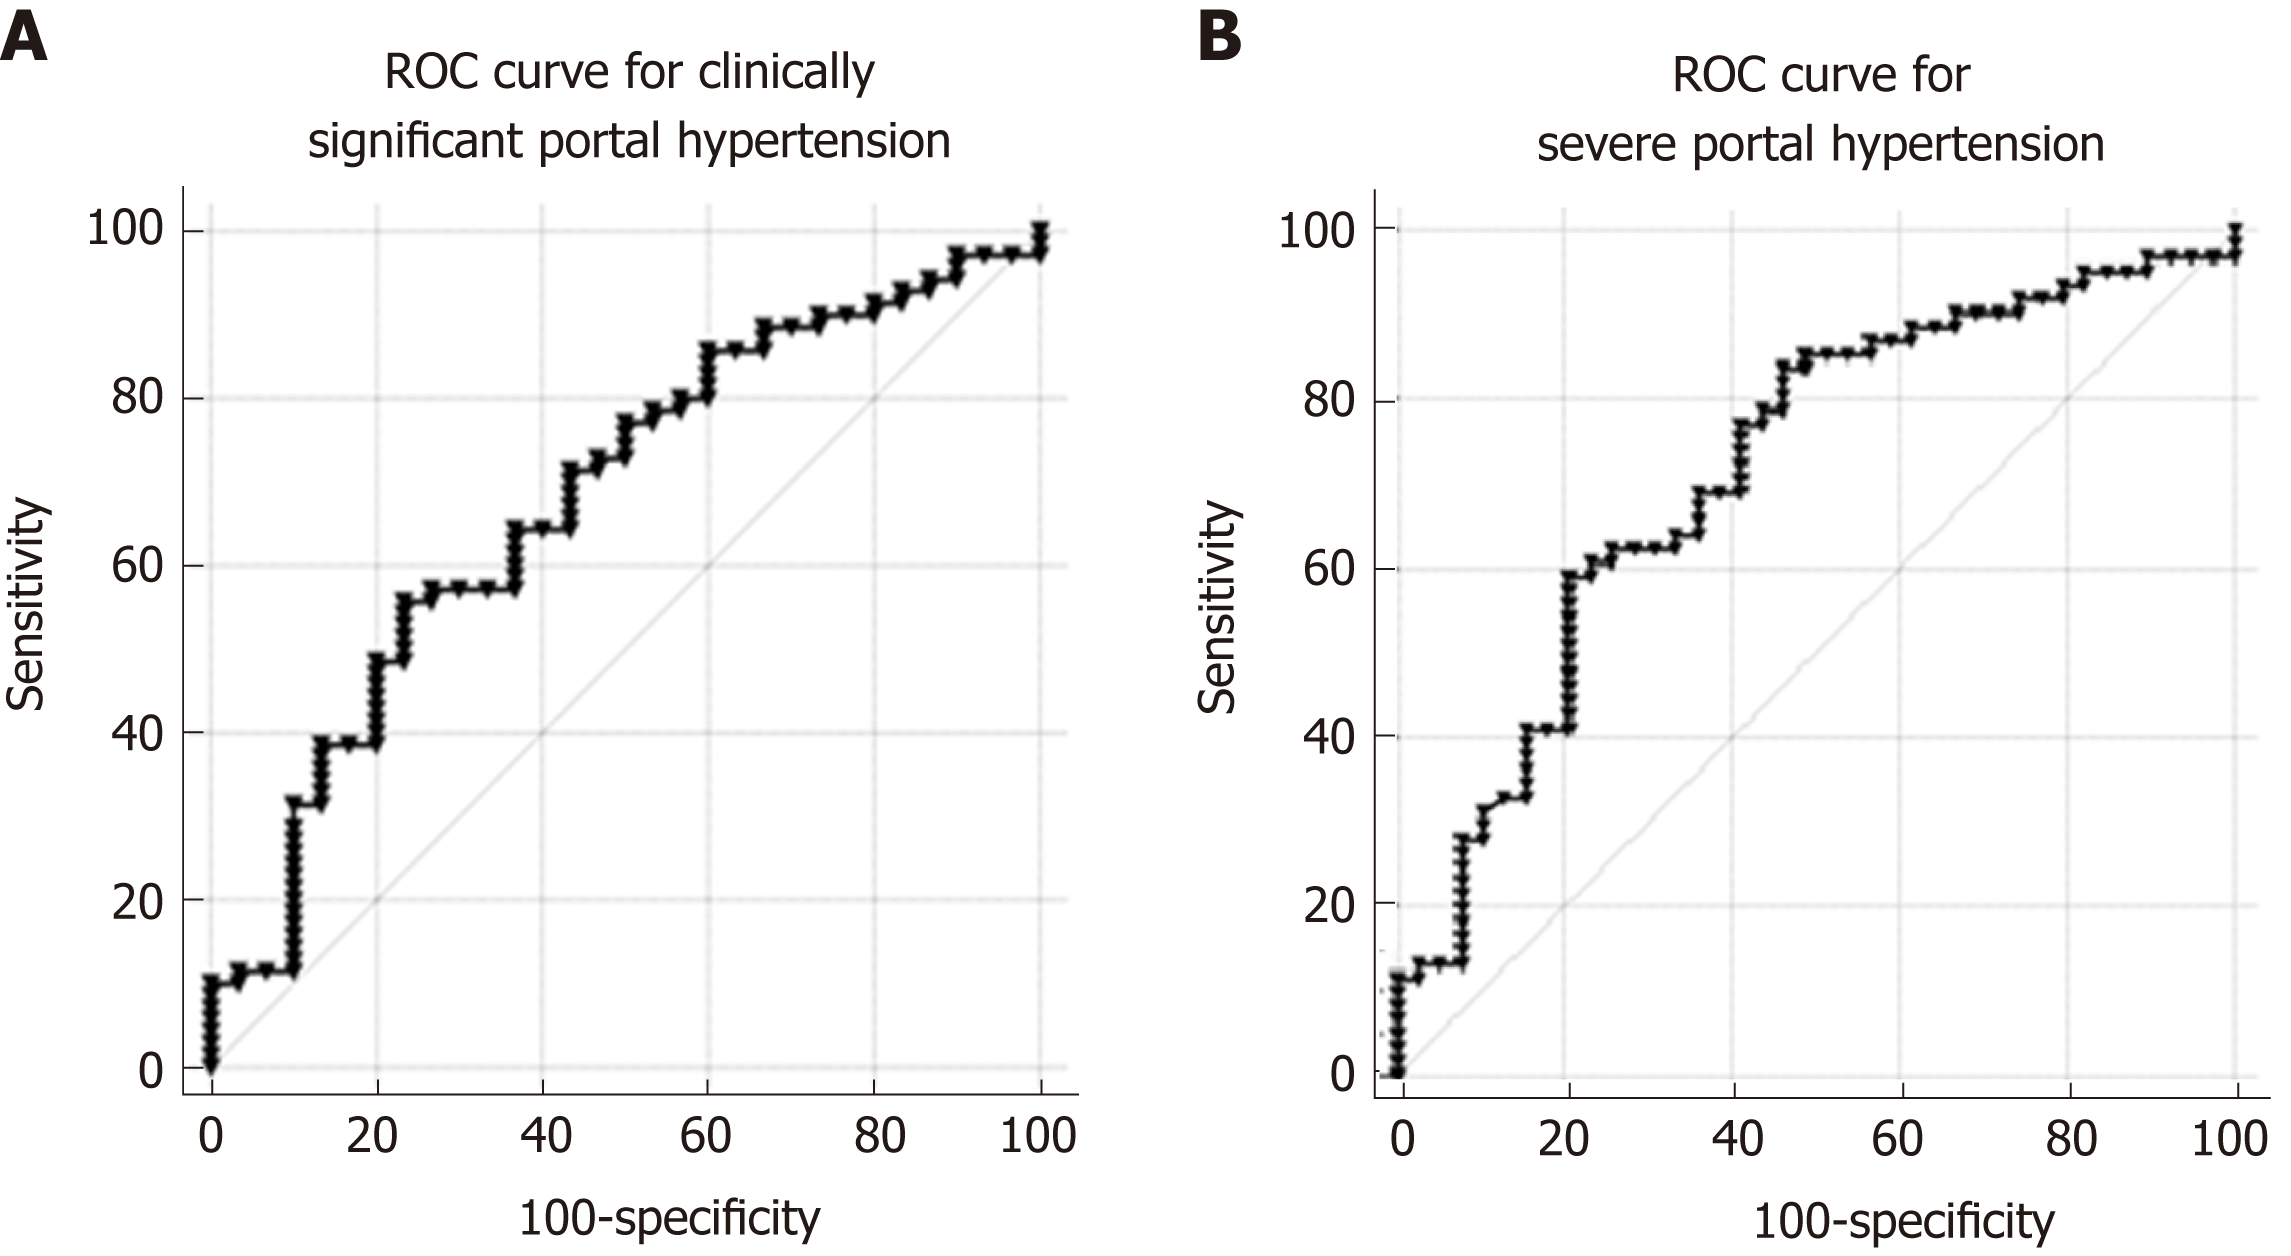
Figure 4 Receiver operating characteristic curves showing placental growth factor prediction of clinically significant portal hypertension (A) and severe portal hypertension (B).
ROC: Receiver operating characteristic.
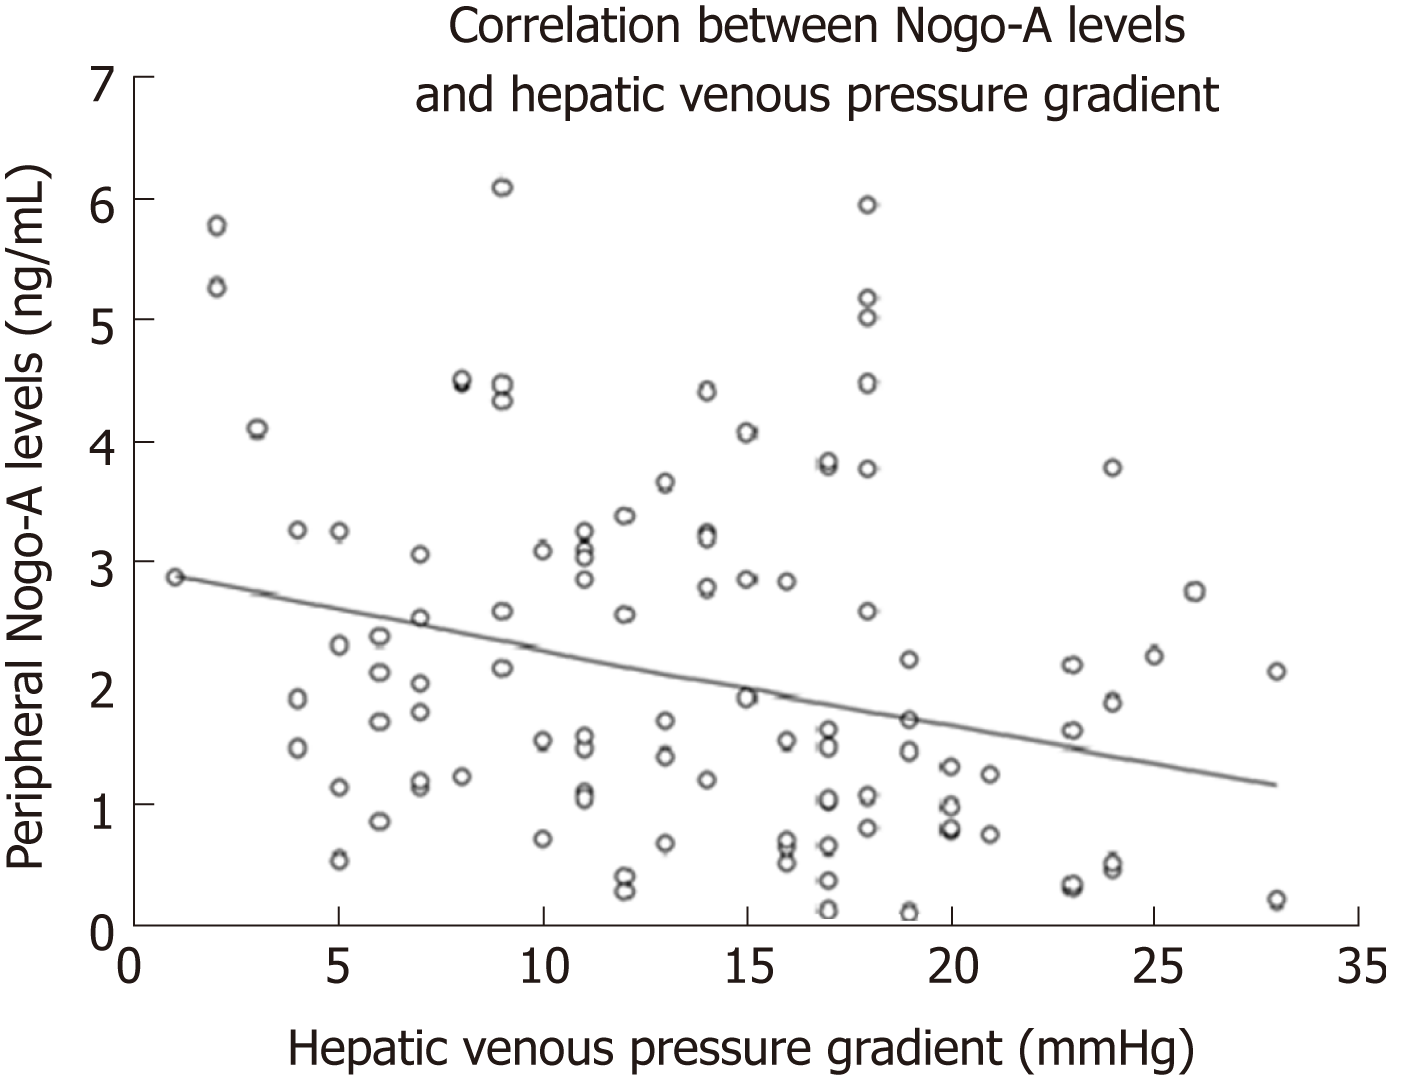
Figure 5 Relationship between peripheral Nogo-A levels and hepatic venous pressure gradient.
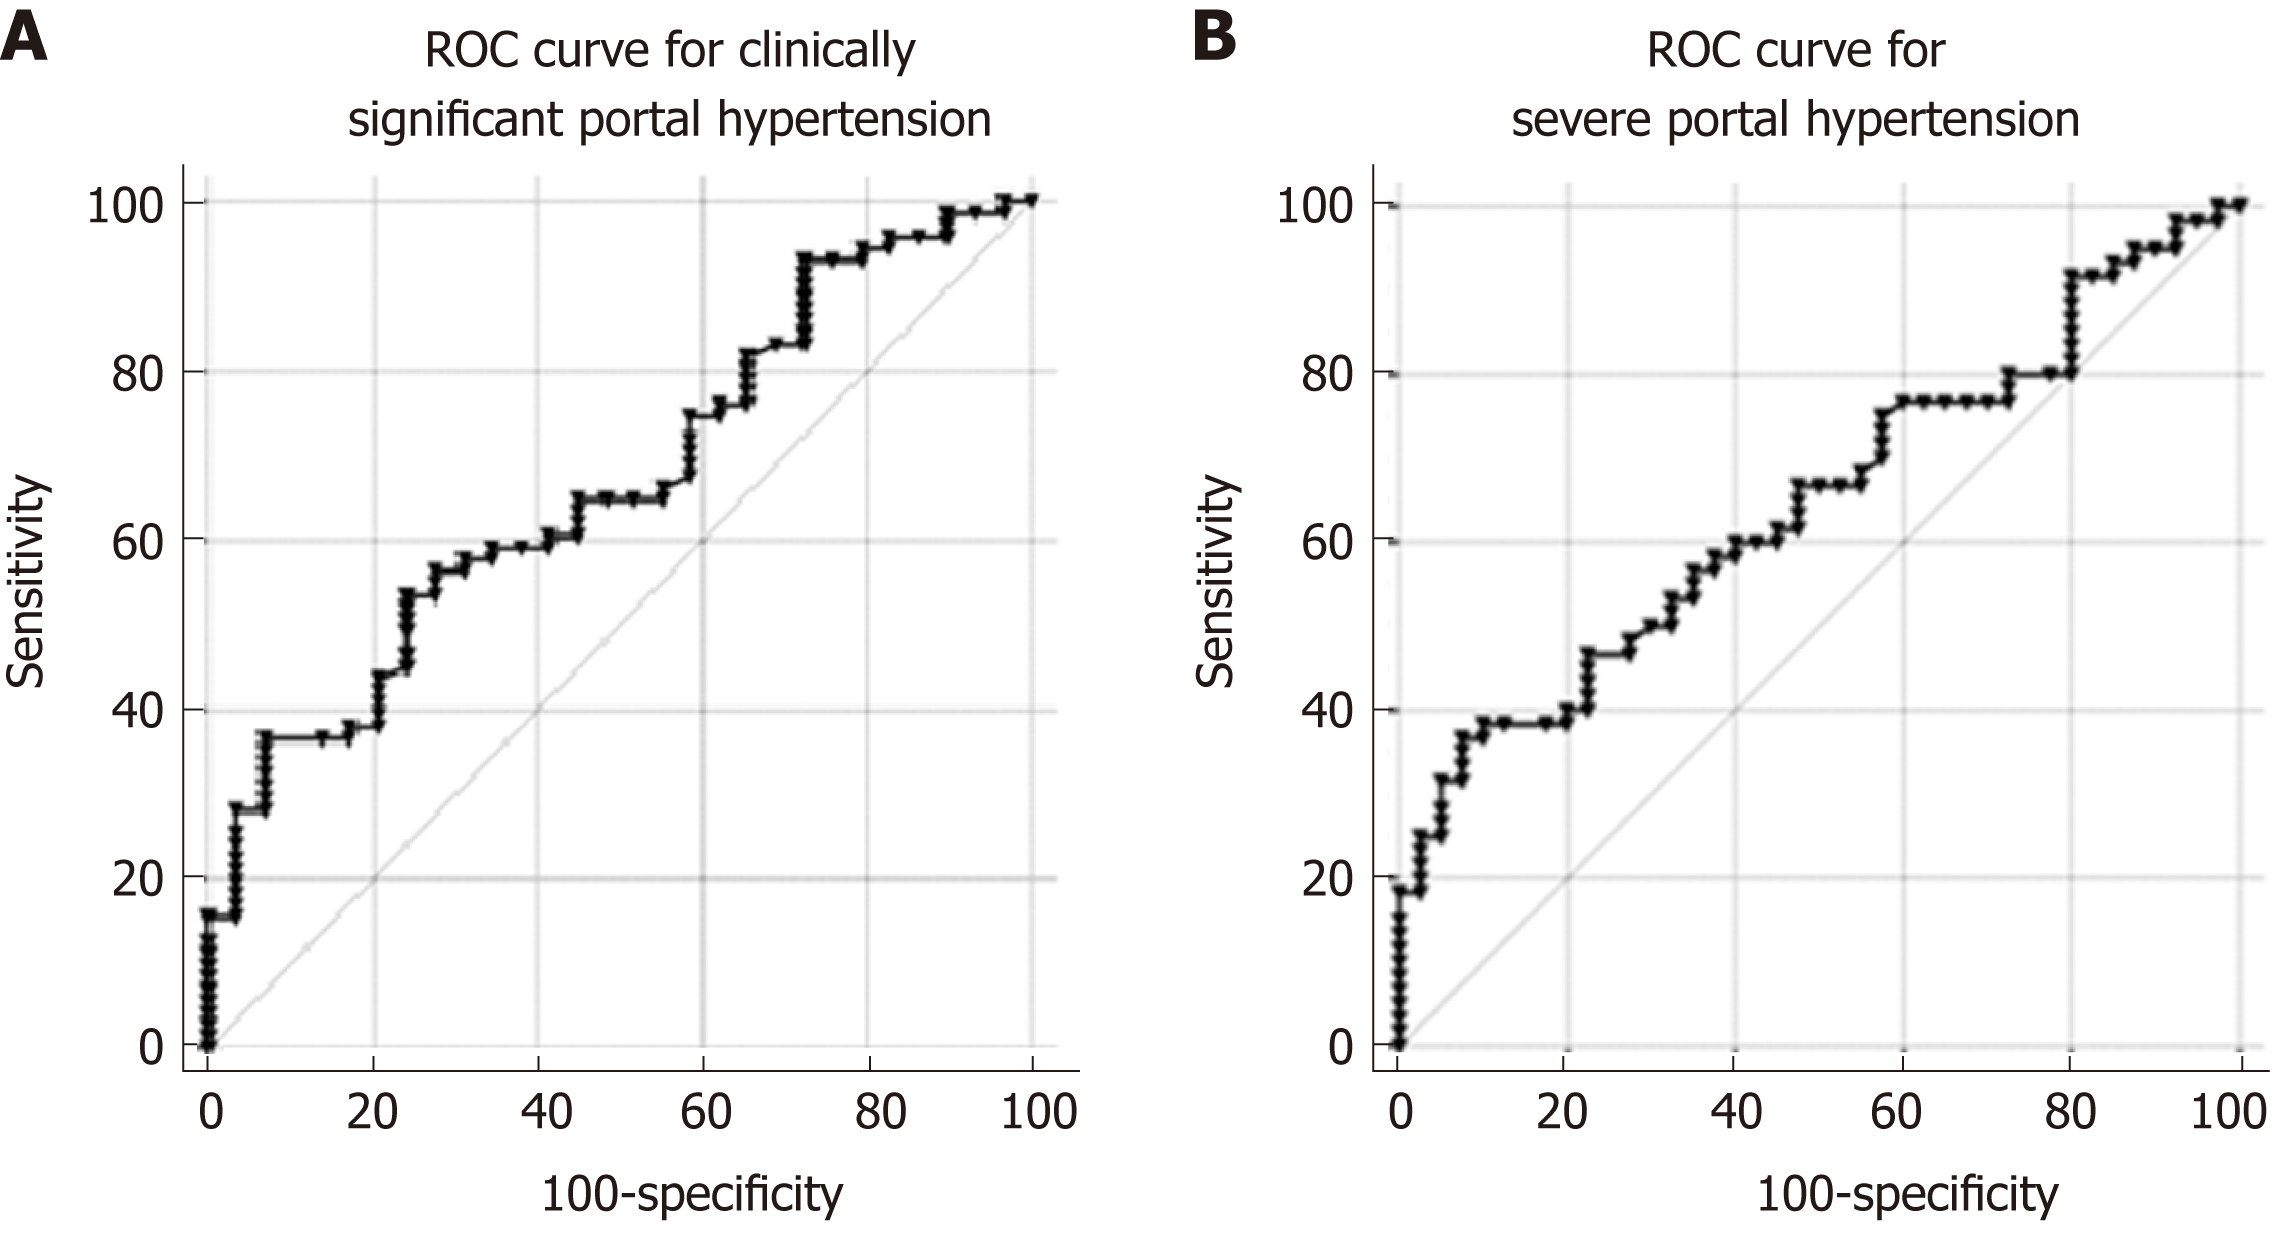
Figure 6 Receiver operating characteristic curves showing Nogo-A protein prediction of clinically significant portal hypertension (A) and severe portal hypertension (B).
ROC: Receiver operating characteristic.
- Citation: Gelman S, Salteniene V, Pranculis A, Skieceviciene J, Zykus R, Petrauskas D, Kupcinskas L, Canbay A, Link A, Kupcinskas J. Plasma Nogo-A and placental growth factor levels are associated with portal hypertension in patients with liver cirrhosis. World J Gastroenterol 2019; 25(23): 2935-2946
- URL: https://www.wjgnet.com/1007-9327/full/v25/i23/2935.htm
- DOI: https://dx.doi.org/10.3748/wjg.v25.i23.2935


