Copyright
©The Author(s) 2017.
World J Gastroenterol. Sep 28, 2017; 23(36): 6705-6714
Published online Sep 28, 2017. doi: 10.3748/wjg.v23.i36.6705
Published online Sep 28, 2017. doi: 10.3748/wjg.v23.i36.6705
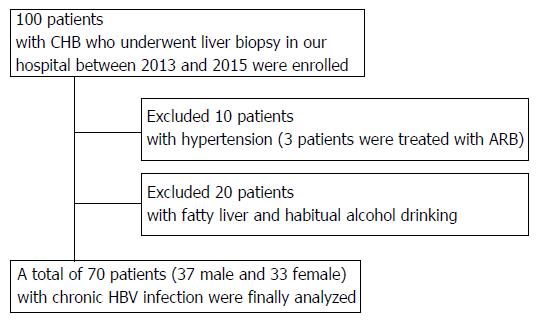
Figure 1 The selection of the study population.
70 patients except for 10 patients with hypertension and 20 patients with fatty liver or habitual alcoholic consumption were finally analyzed.
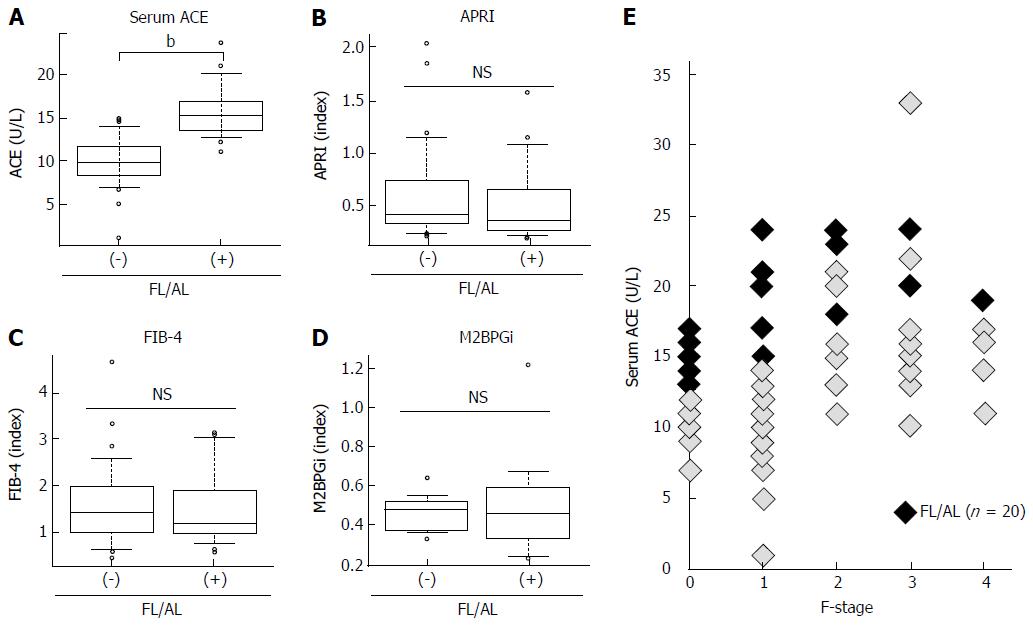
Figure 2 Serum levels of angiotensin-converting enzyme and fibrotic markers in patients with fatty liver and/or habitual alcoholic drinking.
A: Serum angiotensin-converting enzyme (ACE) level; B: Aspartate aminotransferase to platelet index (APRI); C: Fibrosis index based on the four factors (FIB-4), D: Serum Mac-2 binding protein glycosylation isomer (M2BPGi) level in chronic hepatitis B patients with and without fatty liver and/or habitual alcoholic drinking (FL/AL). Serum ACE levels were significantly higher in the patients with FL/AL than those without FL/AL; E: Fibrosis stage-matched comparison showed that this difference in serum ACE levels between with and without FL/AL was prevalently observed in early stages (F0 and F1) of liver fibrosis. Data are means ± SD, bP < 0.01.
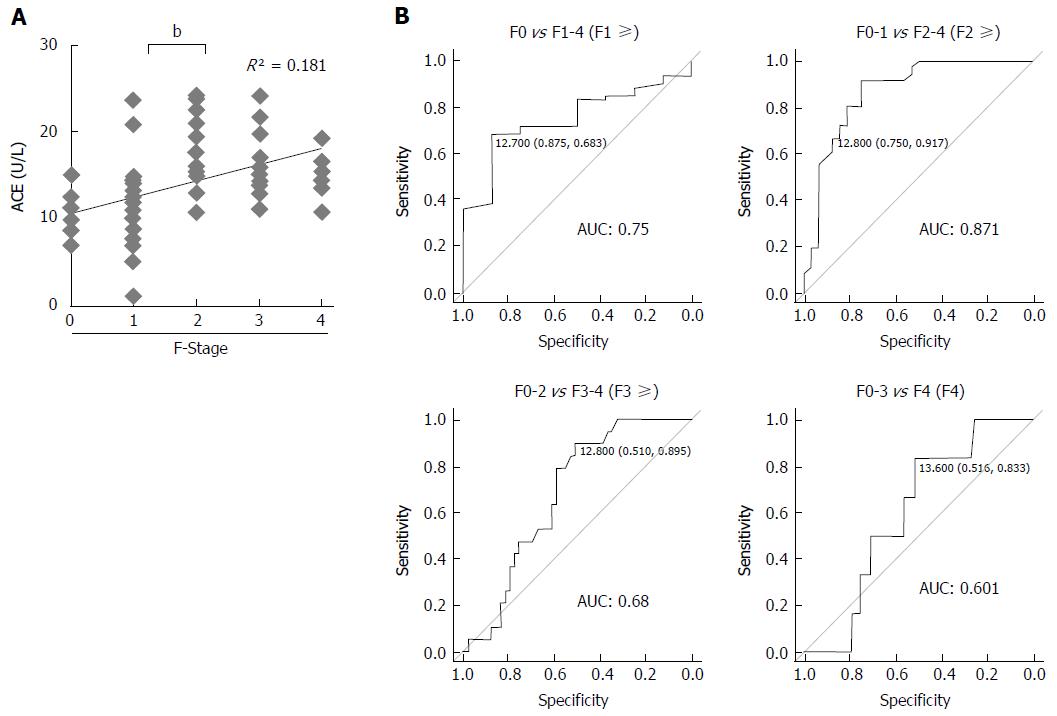
Figure 3 Serum angiotensin-converting enzyme levels and liver fibrosis development in patients with chronic hepatitis B.
A: Correlation between serum angiotensin-converting enzyme (ACE) level and liver fibrosis stage (F-Stage) (R = 0.42, R2 = 0.181); B: Receiver operating characteristic curve analysis and area under curve (AUC) value for diagnostic performance of serum ACE level for predicting each stage of liver fibrosis. The optimal ACE level cut-off point for significant fibrosis was 12.8 U/L. Data are means ± SD, bP < 0.01.
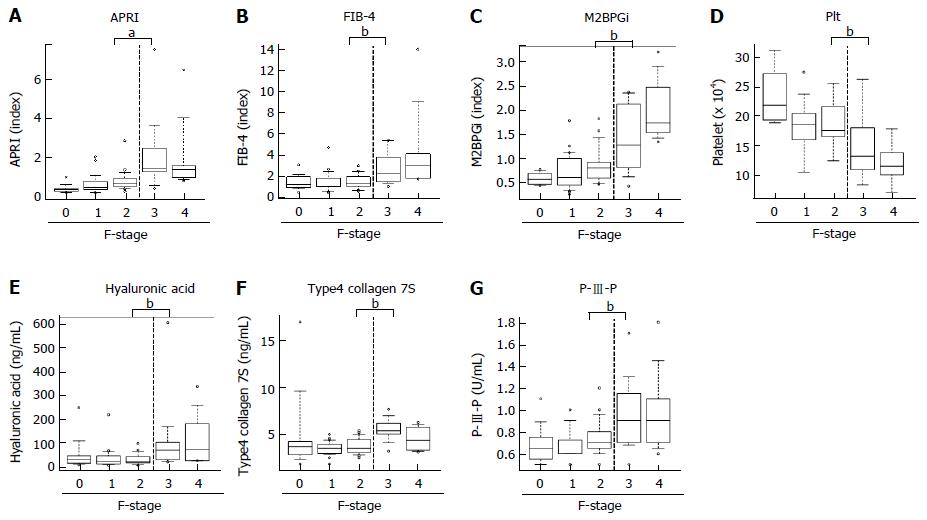
Figure 4 Serum levels of other markers and liver fibrosis in patients with chronic hepatitis B.
A: Aspartate aminotransferase to platelet index (APRI); B: Fibrosis index based on the four factors (FIB-4); C: Serum levels of Mac-2 binding protein glycosylation isomer (M2BPGi); D: The number of platelets (Plt); E: Serum hyaluronic acid level; F: Type4 collagen 7S; and G: P-III-P levels in patients with each liver fibrotic stage (F-Stage). Data are means ± SD, aP < 0.05, bP < 0.01.
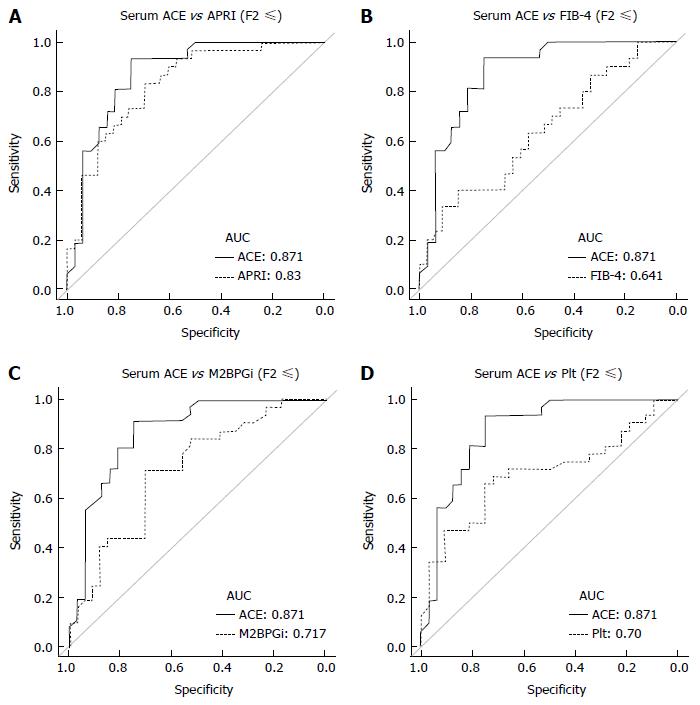
Figure 5 Receiver operating characteristic curve analysis for diagnostic performance for predicting significant liver fibrosis.
Compared to other markers, the area under curve (AUC) value in serum angiotensin-converting enzyme (ACE) level, 0.871, was higher than that in A: Aspartate aminotransferase to platelet index (APRI), 0.83 (P = 0.224); B: Fibrosis index based on the four factors (FIB-4), 0.641 (P = 0.0012); C: Serum levels of Mac-2 binding protein glycosylation isomer (M2BPGi), 0.717 (P = 0.0239); D: The number of platelets (Plt), 0.70 (P = 0.016).
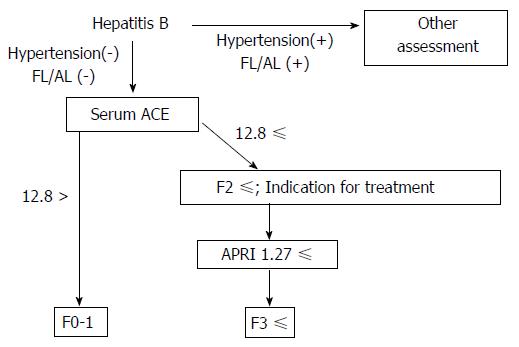
Figure 6 Schematic algorithm for noninvasive diagnosis of chronic hepatitis B.
ACE: Angiotensin-converting enzyme; FL: Fatty liver; AL: Habitual alcoholic drinking; APRI: Aspartate aminotransferase to platelet index.
- Citation: Noguchi R, Kaji K, Namisaki T, Moriya K, Kitade M, Takeda K, Kawaratani H, Okura Y, Aihara Y, Furukawa M, Mitoro A, Yoshiji H. Serum angiotensin-converting enzyme level for evaluating significant fibrosis in chronic hepatitis B. World J Gastroenterol 2017; 23(36): 6705-6714
- URL: https://www.wjgnet.com/1007-9327/full/v23/i36/6705.htm
- DOI: https://dx.doi.org/10.3748/wjg.v23.i36.6705


