Copyright
©The Author(s) 2017.
World J Gastroenterol. Jun 28, 2017; 23(24): 4437-4443
Published online Jun 28, 2017. doi: 10.3748/wjg.v23.i24.4437
Published online Jun 28, 2017. doi: 10.3748/wjg.v23.i24.4437
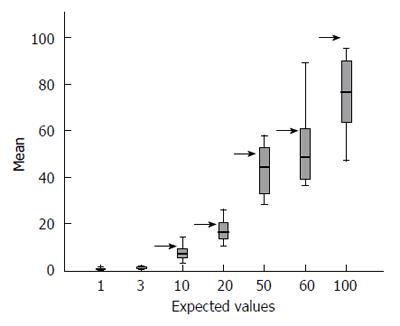
Figure 1 Mean observed results with the relative interquartile ranges.
The arrows indicate the expected values.
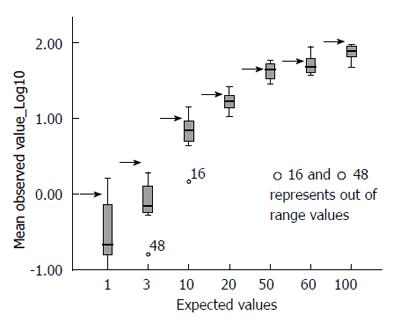
Figure 2 Means of log-transformed observed results stratified according to the expected values, which are indicated by an arrow.
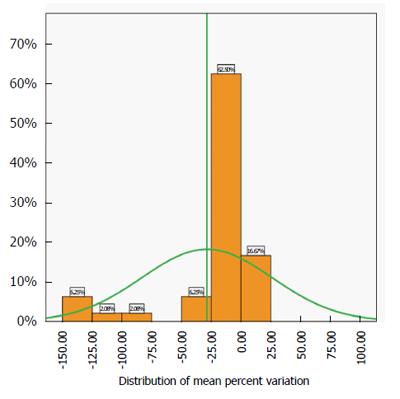
Figure 3 Mean percent variation [(Vo - Vr/Vr) × 100] distribution; green lines indicate the mean and normal distribution.
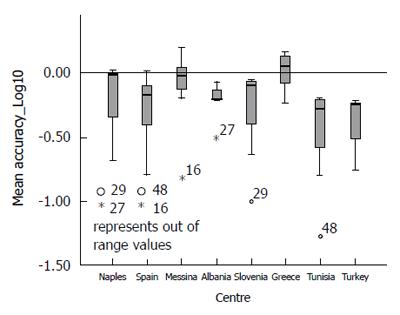
Figure 4 Mean accuracy (Vo - Vr) stratified according to centre, logarithmic scale.
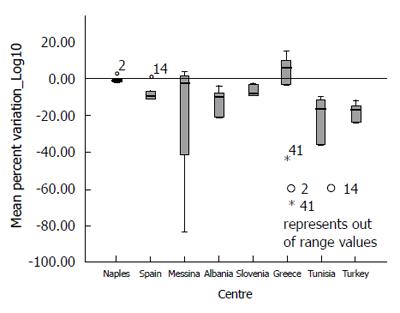
Figure 5 Mean percent variation ([(Vo - Vr)/Vr] × 100) stratified according to centre, logarithmic scale.
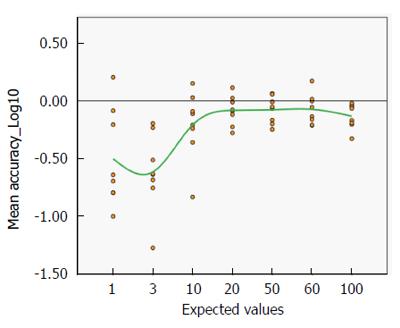
Figure 6 Mean accuracy (Vo - Vr) stratified according to the expected values, logarithmic results.
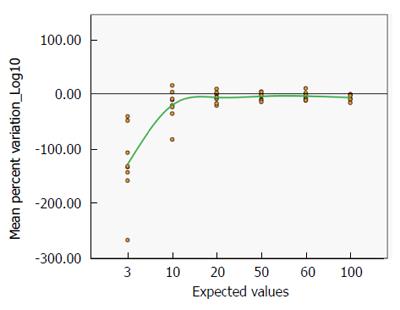
Figure 7 Mean Percent Variation ([(Vo - Vr)/Vr] × 100) stratified according to the expected values, logarithmic results.
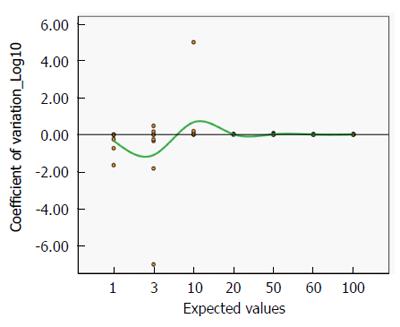
Figure 8 Mean coefficient of Variation (σ/μ) stratified according to the expected values, logarithmic scale.
- Citation: Smarrazzo A, Magazzù G, Ben-Hariz M, Legarda Tamara M, Velmishi V, Roma E, Kansu A, Mičetić-Turk D, Bravi E, Stellato P, Arcidiaco C, Greco L. Variability of anti-human transglutaminase testing in celiac disease across Mediterranean countries. World J Gastroenterol 2017; 23(24): 4437-4443
- URL: https://www.wjgnet.com/1007-9327/full/v23/i24/4437.htm
- DOI: https://dx.doi.org/10.3748/wjg.v23.i24.4437


