Copyright
©The Author(s) 2017.
World J Gastroenterol. Apr 21, 2017; 23(15): 2802-2810
Published online Apr 21, 2017. doi: 10.3748/wjg.v23.i15.2802
Published online Apr 21, 2017. doi: 10.3748/wjg.v23.i15.2802
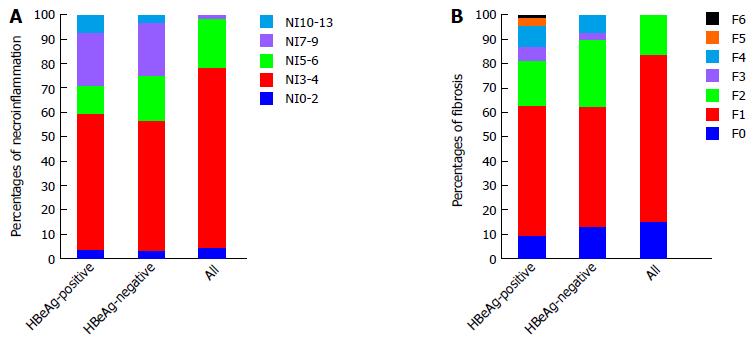
Figure 1 Distribution of the liver histological score by hepatitis e antigen status.
A: Percentages of liver necroinflammation in HBeAg-positive, HBeAg-negative and total patients; B: Percentages of liver fibrosis in HBeAg-positive, HBeAg-negative and total patients. HBeAg: Hepatitis e antigen.
Figure 2 Characteristics of marked hepatic necroinflammation and fibrosis.
A: Piecemeal necrosis; B: Multi-site focal necrosis; C: The Rosette structure; D: Bridging fibrosis with Masson-trichrome straining.
Figure 3 Comparison of percentage of liver biopsies with marked histological abnormalities between those with low and high normal alanine aminotransferase levels.
A: Percentages of marked necroinflammation in patients with two different ALT levels; B: Percentages of marked fibrosis in patients with two different ALT levels. HBeAg: Hepatitis e antigen; ALT: Alanine aminotransferase.
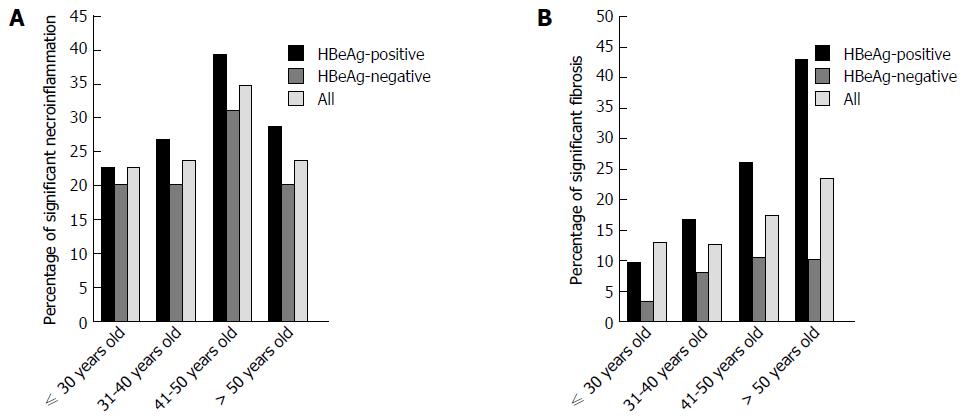
Figure 4 Percentages of liver biopsies with marked necroinflammation and fibrosis categorized by age.
A: Percentages of marked necroinflammation in different age groups; B: Percentages of marked fibrosis in different age groups. HBeAg: Hepatitis e antigen.
Figure 5 Receiver operating characteristic curve analysis for significant histological activity index (HAI ≥ 7) and fibrosis score (Ishak ≥ 3).
A: AUC estimation for the AST level; B: AUC estimation for the PLT level; C: AUC estimation for the GGT level. AST: Aspartate transaminase; AUC: Area under the curve; PLT: Platelet.
- Citation: Cheng JL, Wang XL, Yang SG, Zhao H, Wu JJ, Li LJ. Non-ALT biomarkers for markedly abnormal liver histology among Chinese persistently normal alanine aminotransferase-chronic hepatitis B patients. World J Gastroenterol 2017; 23(15): 2802-2810
- URL: https://www.wjgnet.com/1007-9327/full/v23/i15/2802.htm
- DOI: https://dx.doi.org/10.3748/wjg.v23.i15.2802


