Copyright
©The Author(s) 2017.
World J Gastroenterol. Apr 21, 2017; 23(15): 2771-2784
Published online Apr 21, 2017. doi: 10.3748/wjg.v23.i15.2771
Published online Apr 21, 2017. doi: 10.3748/wjg.v23.i15.2771
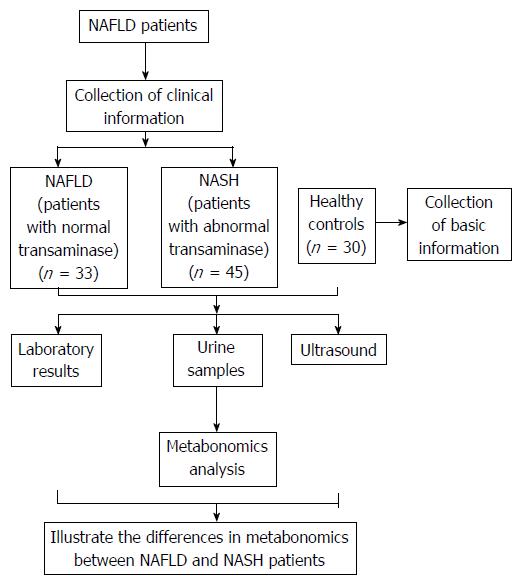
Figure 1 Flow diagram of the study protocol.
NASH: Non-alcoholic steatohepatitis; NAFLD: Non-alcoholic fatty liver disease.
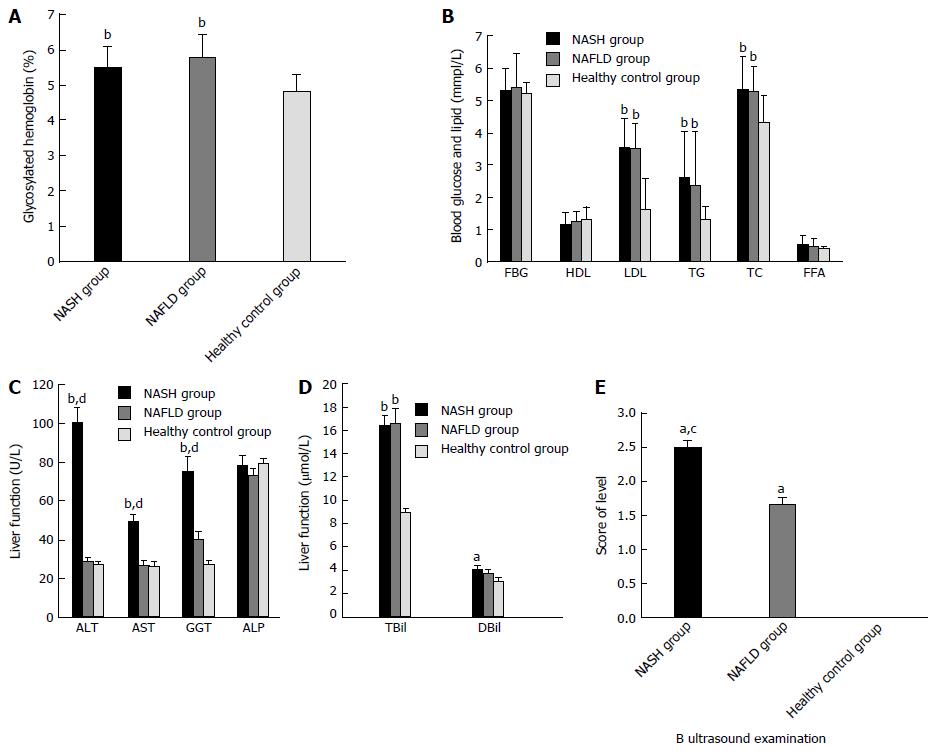
Figure 2 Characteristics of the study participants.
Mean concentrations of (A) glycosylated hemoglobin (HbA1c); (B) fasting blood glucose (FBG), high-density lipoprotein cholesterol (HDL-C), low-density lipoprotein cholesterol (LDL-C), triglycerides (TG), total cholesterol (TC); (C) alanine aminotransferase (ALT), and aspartate aminotransferase (AST), gamma-glutamyl transferase (GGT), and alpha-fetoprotein (AFP); and (D) total bilirubin (TBil) and direct bilirubin (DBil) in the non-alcoholic fatty liver disease (NAFLD), non-alcoholic steatohepatitis (NASH), and healthy control groups. E: Results of ultrasound examination in the three groups. Significant differences among the three groups were assessed by one-way ANOVA in A-D and by t-tests in E. aP < 0.05, bP < 0.01 vs the control group; cP < 0.05, dP < 0.01 vs the NAFLD group.
Figure 3 S-plots of PCA analysis (A) with electrospray ionization (ESI+) and (B) without electrospray ionization (ESI-) in the non-alcoholic steatohepatitis, non-alcoholic fatty liver disease, no comma symbol and control groups.
PCA: Principal component analysis; NASH: Non-alcoholic steatohepatitis; NAFLD: Non-alcoholic fatty liver disease.
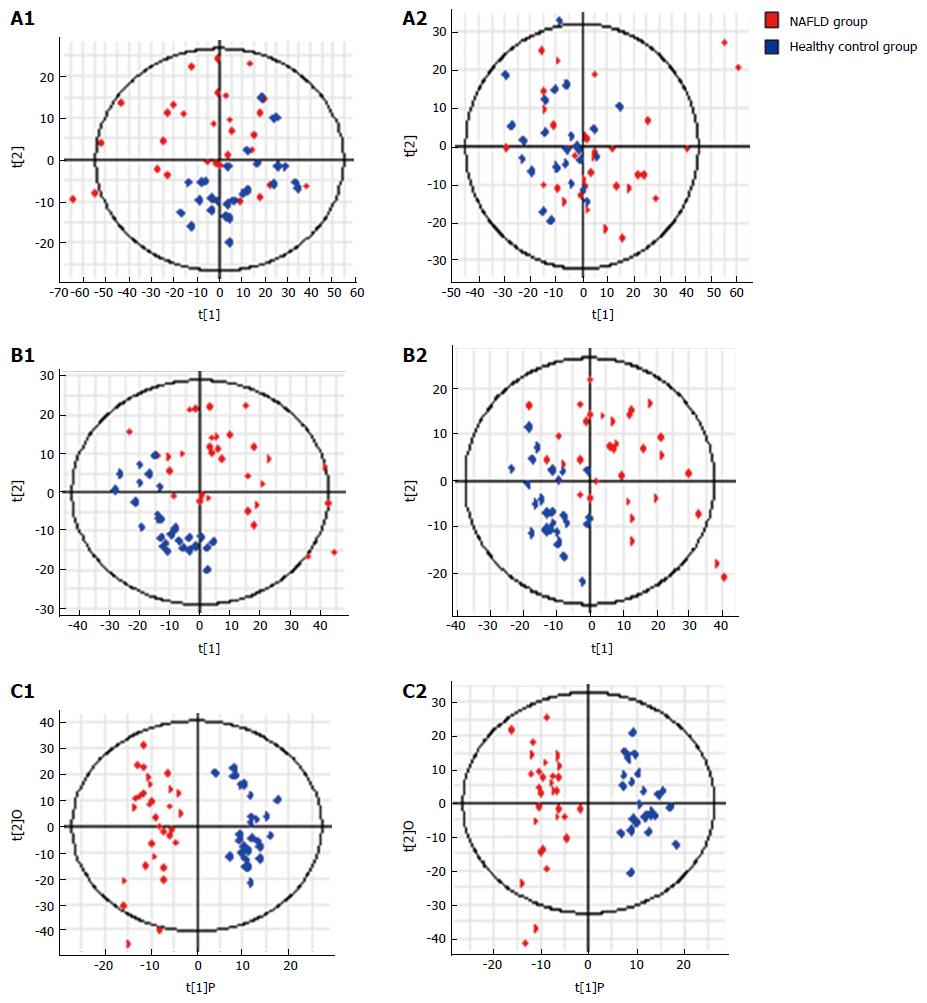
Figure 4 S-plots following (A) PCA, (B) PLS, and (C) OPLS analyses with (A1, B1 and C1) electrospray ionization (ESI+) and without (A2, B2 and C2) electrospray ionization (ESI-) in the non-alcoholic fatty liver disease and control groups.
PCA: Principal component analysis; NASH: Non-alcoholic steatohepatitis; NAFLD: Non-alcoholic fatty liver disease.
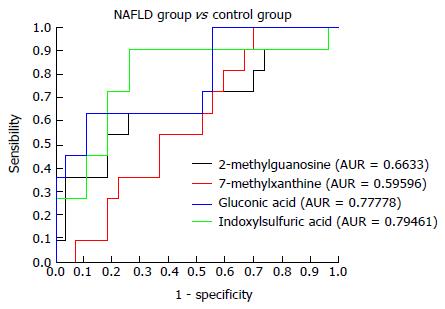
Figure 5 Receiver operating characteristic curves for 2-methylguanosine, 7-methylxanthine, gluconic acid, and indoxylsulfuric acid in the non-alcoholic fatty liver disease and control groups.
NAFLD: Non-alcoholic fatty liver disease.
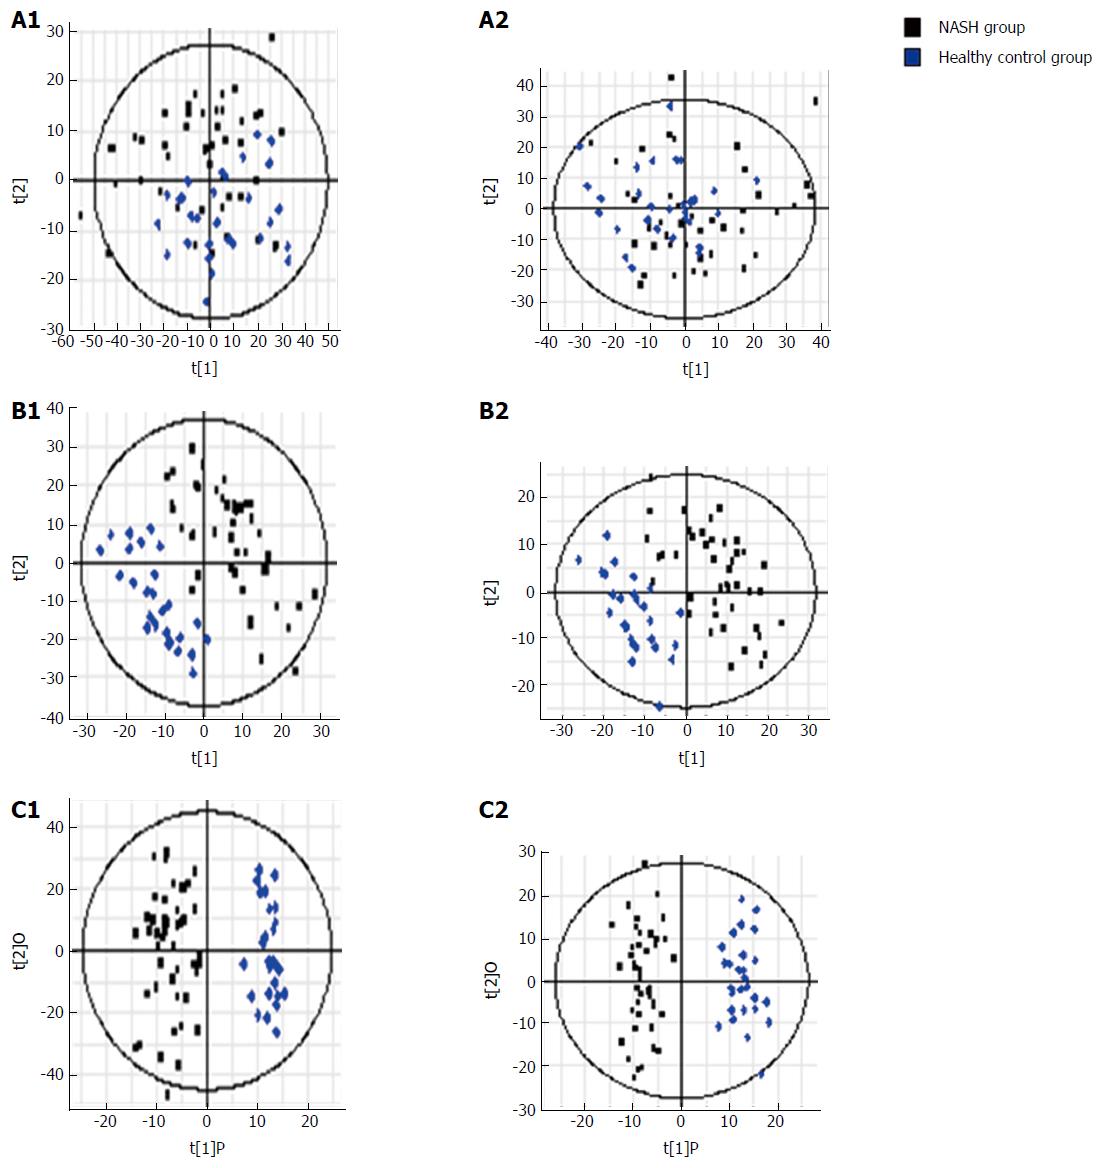
Figure 6 S-plots following (A) PCA, (B) PLS, and (C) OPLS analyses with (A1, B1, C1) electrospray ionization (ESI+) and without (A2, B2, C2) electrospray ionization (ESI-) in the non-alcoholic steatohepatitis and control groups.
PCA: Principal component analysis; NASH: Non-alcoholic steatohepatitis.
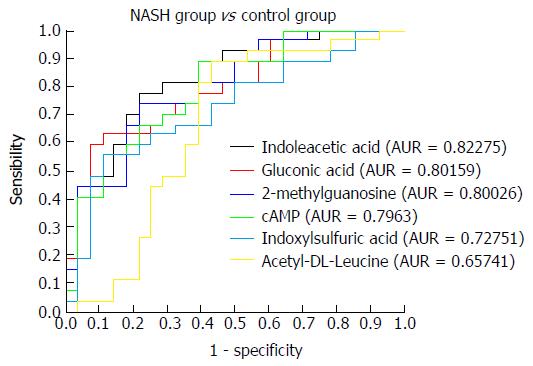
Figure 7 Receiver operating characteristic curves for indoleacetic acid, gluconic acid, 2-methylguanosine, cAMP, indoxylsulfuric acid, and acetyl-DL-leucine in the non-alcoholic steatohepatitis and control groups.
NASH: Non-alcoholic steatohepatitis.
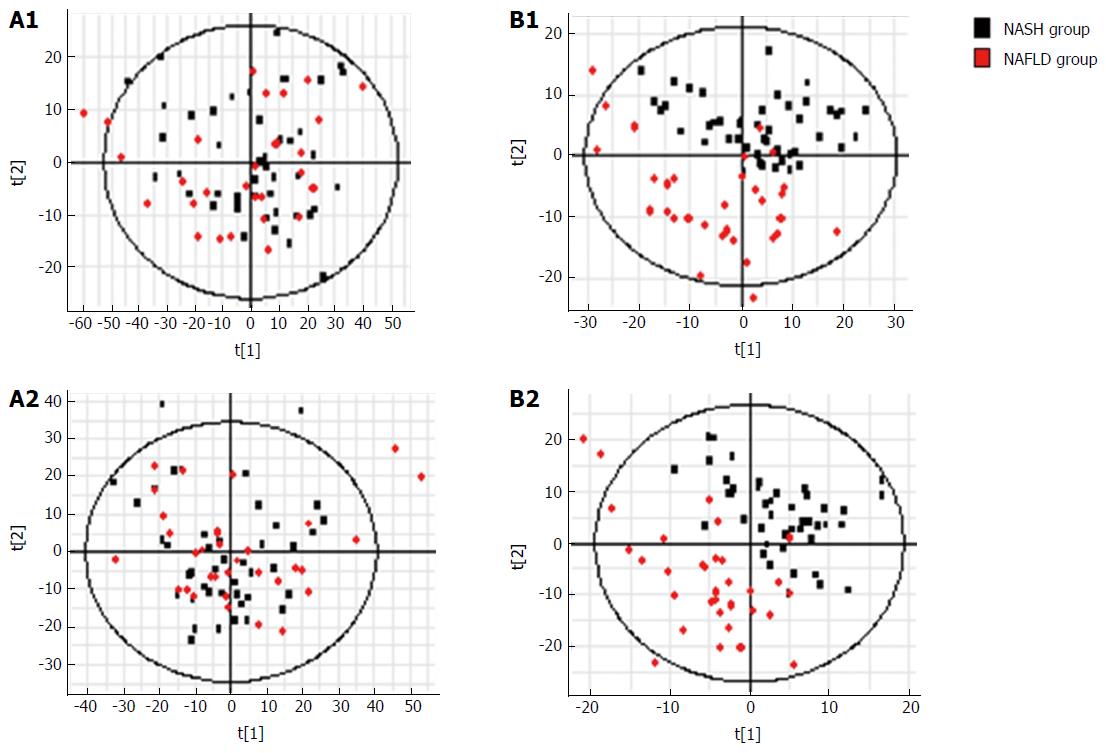
Figure 8 S-plots following (A) PCA and (B) PLS analyses with (A1, B1) electrospray ionization (ESI+) and without (A2, B2) electrospray ionization (ESI-) in the non-alcoholic steatohepatitis and non-alcoholic fatty liver disease groups.
NAFLD: Non-alcoholic fatty liver disease; NASH: Non-alcoholic steatohepatitis.
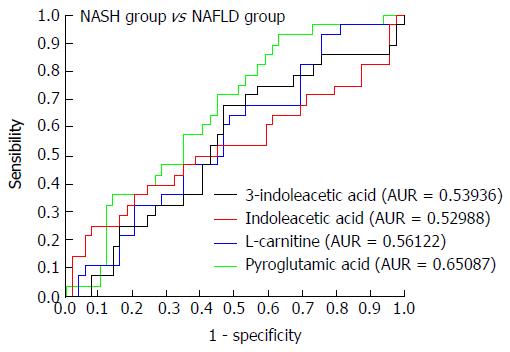
Figure 9 Receiver operating characteristic curves for 3-indoleacetic acid, indoleacetic acid, L-carnitine, and pyroglutamic acid in the non-alcoholic steatohepatitis and non-alcoholic fatty liver disease groups.
NAFLD: Non-alcoholic fatty liver disease; NASH: Non-alcoholic steatohepatitis.
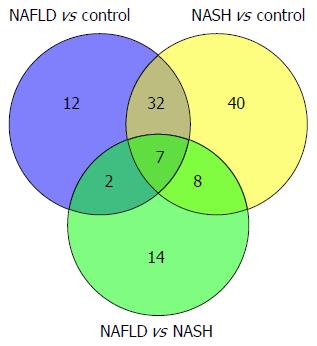
Figure 10 Venn diagram of metabolites differentially expressed in urinary samples of the non-alcoholic fatty liver disease vs control, non-alcoholic steatohepatitis vs control, and non-alcoholic fatty liver disease vs non-alcoholic steatohepatitis groups.
NAFLD: Non-alcoholic fatty liver disease; NASH: Non-alcoholic steatohepatitis.
- Citation: Dong S, Zhan ZY, Cao HY, Wu C, Bian YQ, Li JY, Cheng GH, Liu P, Sun MY. Urinary metabolomics analysis identifies key biomarkers of different stages of nonalcoholic fatty liver disease. World J Gastroenterol 2017; 23(15): 2771-2784
- URL: https://www.wjgnet.com/1007-9327/full/v23/i15/2771.htm
- DOI: https://dx.doi.org/10.3748/wjg.v23.i15.2771


