Copyright
©The Author(s) 2017.
World J Gastroenterol. Apr 21, 2017; 23(15): 2771-2784
Published online Apr 21, 2017. doi: 10.3748/wjg.v23.i15.2771
Published online Apr 21, 2017. doi: 10.3748/wjg.v23.i15.2771
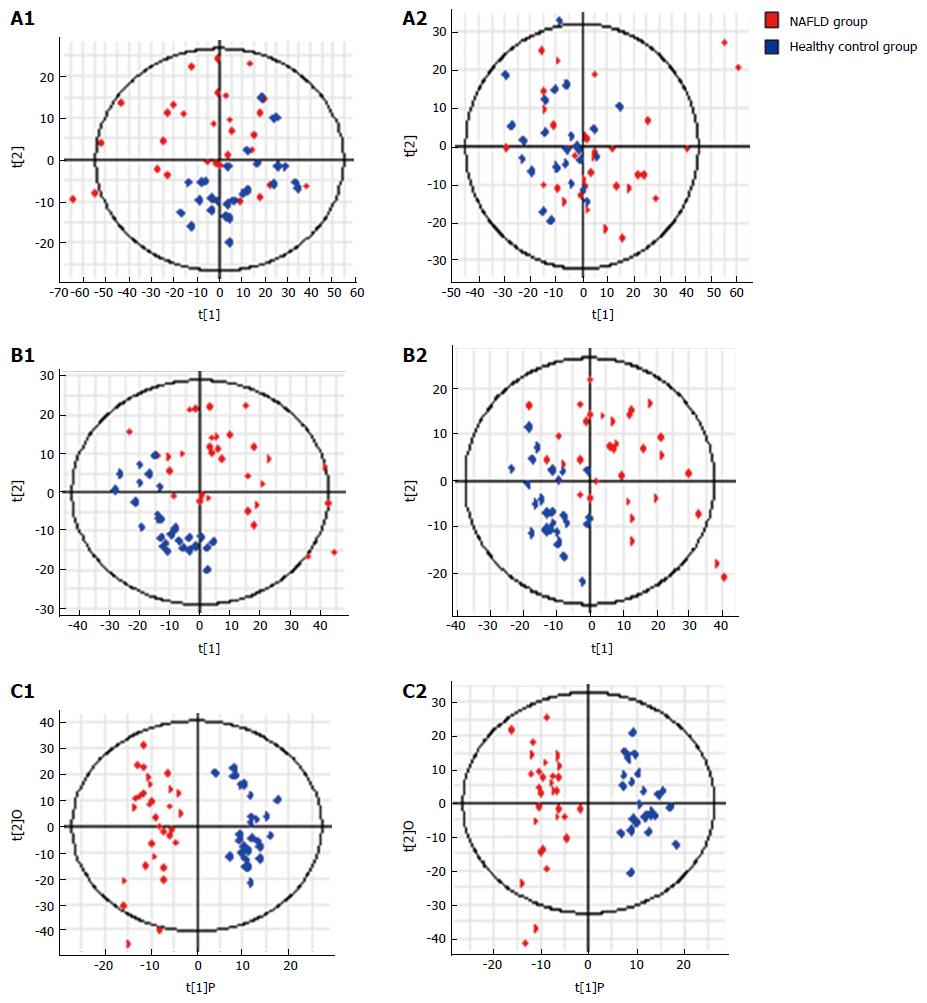
Figure 4 S-plots following (A) PCA, (B) PLS, and (C) OPLS analyses with (A1, B1 and C1) electrospray ionization (ESI+) and without (A2, B2 and C2) electrospray ionization (ESI-) in the non-alcoholic fatty liver disease and control groups.
PCA: Principal component analysis; NASH: Non-alcoholic steatohepatitis; NAFLD: Non-alcoholic fatty liver disease.
- Citation: Dong S, Zhan ZY, Cao HY, Wu C, Bian YQ, Li JY, Cheng GH, Liu P, Sun MY. Urinary metabolomics analysis identifies key biomarkers of different stages of nonalcoholic fatty liver disease. World J Gastroenterol 2017; 23(15): 2771-2784
- URL: https://www.wjgnet.com/1007-9327/full/v23/i15/2771.htm
- DOI: https://dx.doi.org/10.3748/wjg.v23.i15.2771


