Copyright
©The Author(s) 2017.
World J Gastroenterol. Apr 21, 2017; 23(15): 2685-2695
Published online Apr 21, 2017. doi: 10.3748/wjg.v23.i15.2685
Published online Apr 21, 2017. doi: 10.3748/wjg.v23.i15.2685
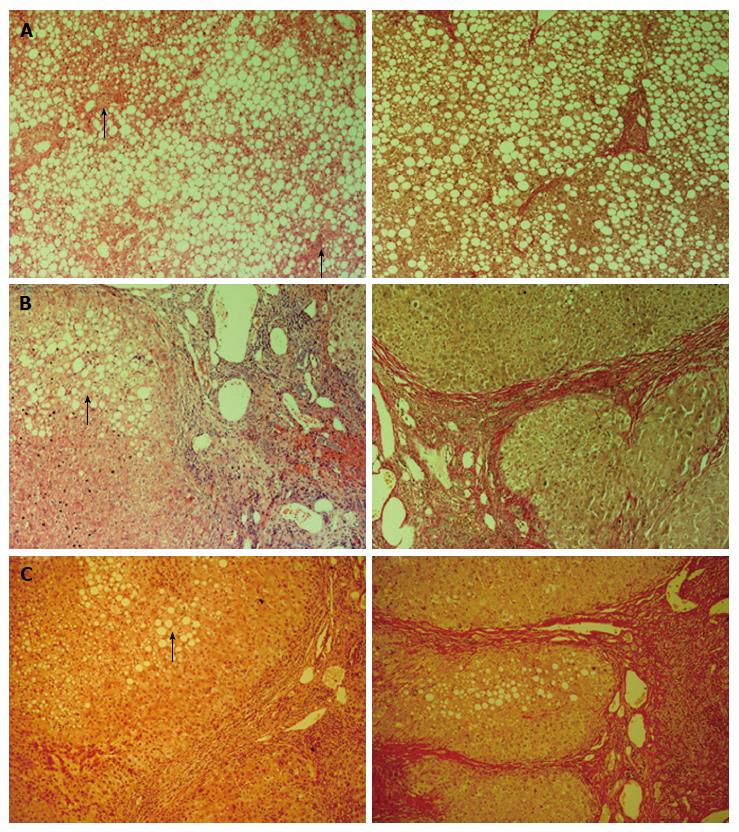
Figure 1 Histological staining of human liver tissue.
Representative images of donor tissue (A), NASH tissue (B) and ARLD liver (C) stained using haematoxylin and eosin (left panel) or Van Gieson stain (right panel). Bar = 100 μm and images were captured at 10 × original magnification. Data are representative of 6-14 samples in each group. Arrows in A indicate areas of localised inflammation present in our steatotic donor livers and arrows in B and C show steatotic hepatocytes. NASH: Nonalcoholic steatohepatitis; ARLD: Alcohol-related liver damage.
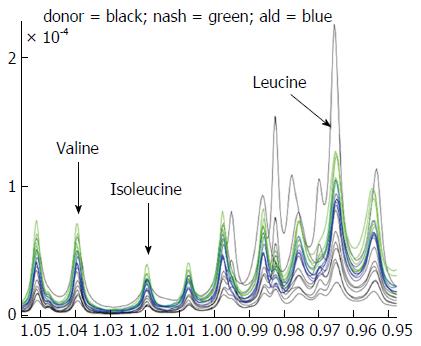
Figure 2 Representative 1H-NMR spectra.
Representative fraction intensity traces from the branched chain amino acid region of the 1H-NMR data for normal (black) NASH (green) and ARLD (blue) livers showing consistency of separation between groups. NASH: Nonalcoholic steatohepatitis; ARLD: Alcohol-related liver damage.
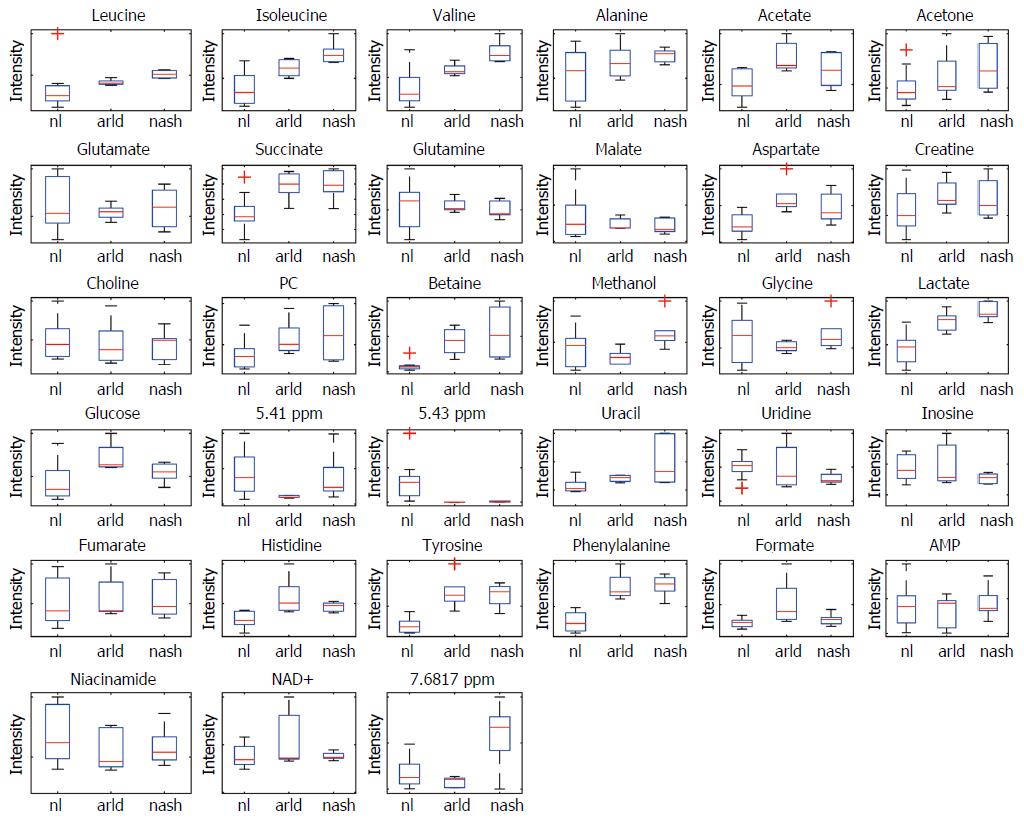
Figure 3 Liver disease is associated with significant changes in energy and protein metabolism and ketone body production.
Fraction intensity boxplots for indicated metabolites in normal liver (nl), ARLD (arld) and NASH (nash) liver samples. For each metabolite shown, an unpaired t-test (Welch's t-test) was calculated with a 5% cut-off to test the null hypothesis that the relative peak intensities for pairs of the different classes have the same mean, variances not assumed to be equal. The solid line indicates the median fractional intensity, and the box shows the interquartile range. Outlier samples are indicated by red crosses and statistical analyses are indicated in Supplemental Table 1. NASH: Nonalcoholic steatohepatitis; ARLD: Alcohol-related liver damage.
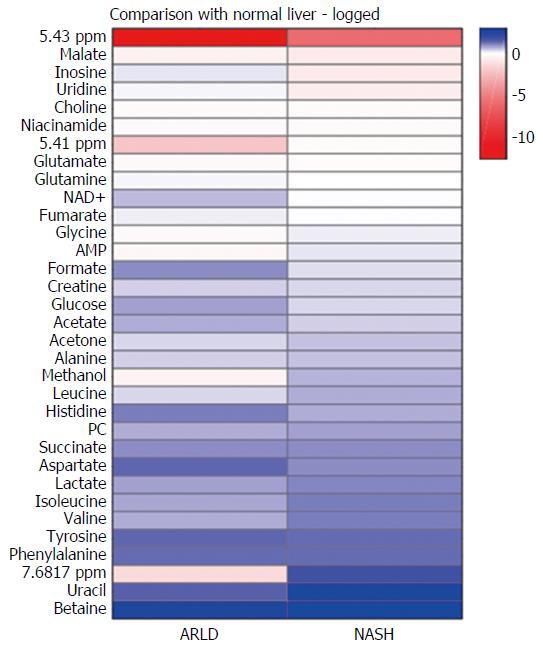
Figure 4 Heat map comparing the alcohol-related liver damage and nonalcoholic steatohepatitis spectra with the donor spectra.
The squares are coloured according to: log2 (mean fractional intensity of metabolite X in class Y/ mean fractional intensity of metabolite X in donor class) with blue indicating that metabolite X is higher in the class Y and red indicating that metabolite X is lower in the class Y. NASH: Nonalcoholic steatohepatitis; ARLD: Alcohol-related liver damage.
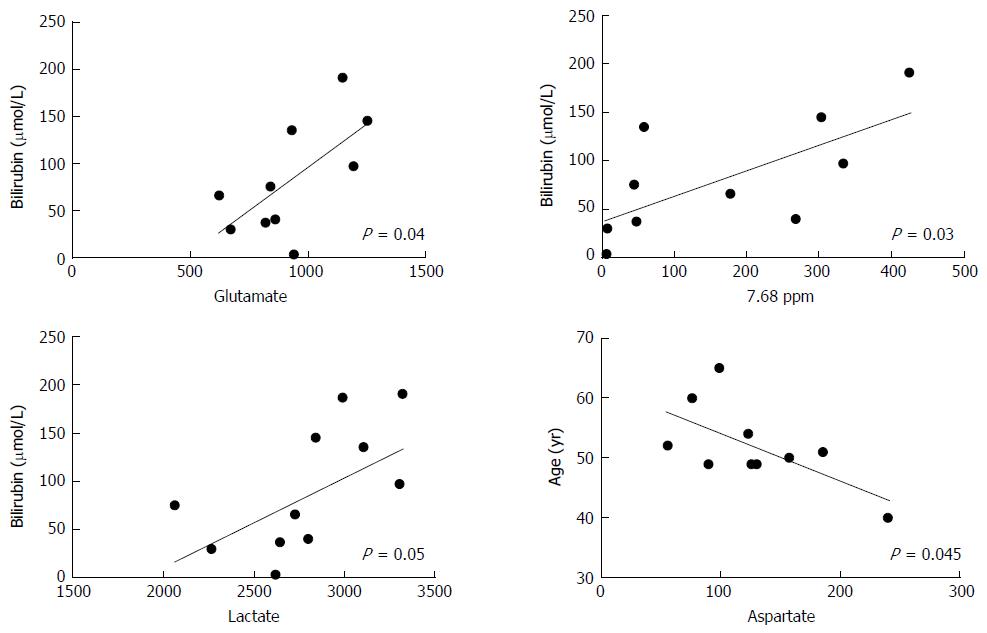
Figure 5 Correlation analysis illustrating relationship between key metabolites and demographic parameters in patients with cirrhosis.
Data are from a smaller cohort of patients with cirrhosis relating to ARLD or NASH for whom our full demographic data was available. Dots indicate individual patient data (n = 10) and analyses shown are those with significant correlation (alpha < 0.05) for fraction intensity of metabolites vs bilirubin concentration or age. NASH: Nonalcoholic steatohepatitis; ARLD: Alcohol-related liver damage.
- Citation: Schofield Z, Reed MA, Newsome PN, Adams DH, Günther UL, Lalor PF. Changes in human hepatic metabolism in steatosis and cirrhosis. World J Gastroenterol 2017; 23(15): 2685-2695
- URL: https://www.wjgnet.com/1007-9327/full/v23/i15/2685.htm
- DOI: https://dx.doi.org/10.3748/wjg.v23.i15.2685


