Copyright
©The Author(s) 2017.
World J Gastroenterol. Jan 7, 2017; 23(1): 93-102
Published online Jan 7, 2017. doi: 10.3748/wjg.v23.i1.93
Published online Jan 7, 2017. doi: 10.3748/wjg.v23.i1.93
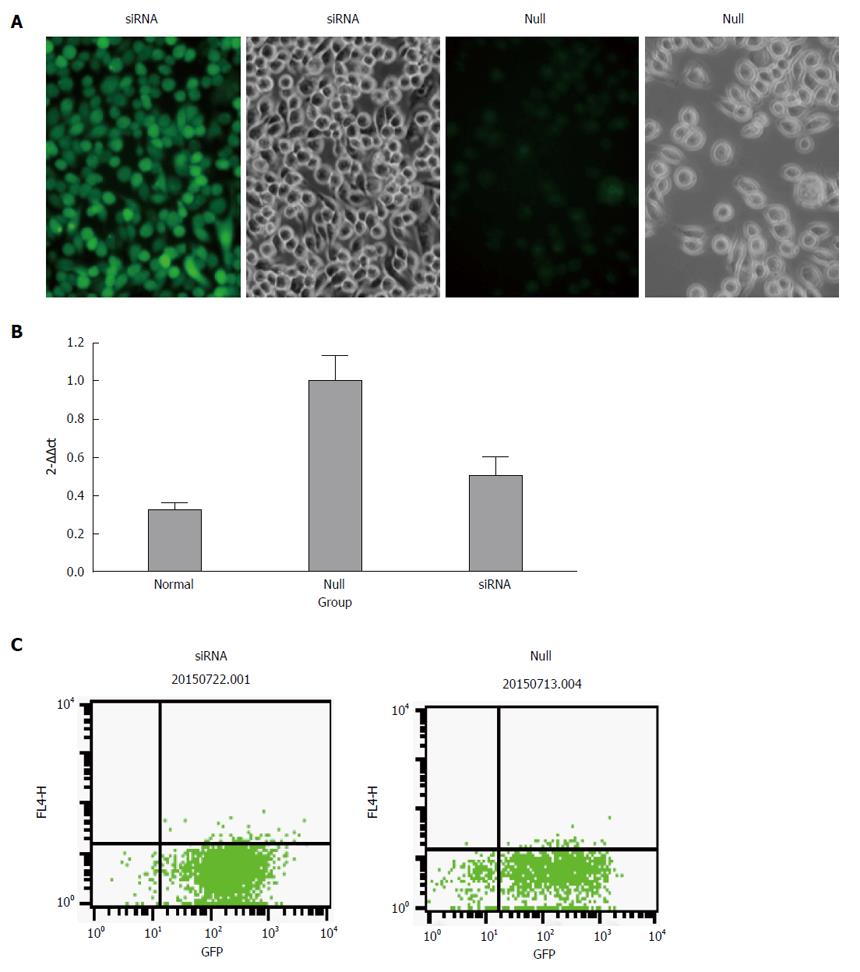
Figure 1 Transduction efficiency and the expression of miR-490-5P after transduction.
A: Renderings of mast cells after lentivirus transfection, the transduction rate in the siRNA group was almost 96%; the transduction rate in the null group was almost 86%; B: The relative expression of miR-490-5p after transduction, which was significantly decreased in the siRNA group compared with the null group; C: Mast cell transfection efficiency detected by flow cytometry, the efficiency in each group was more than 85%.
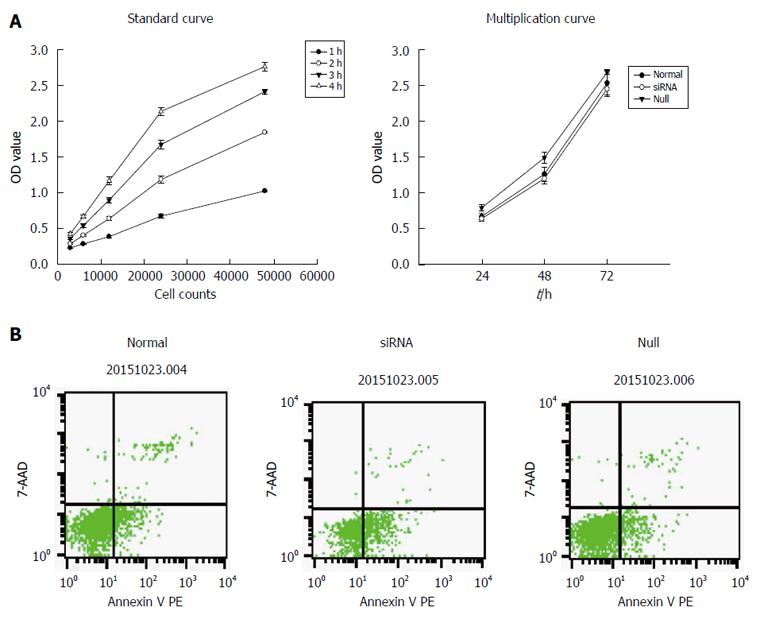
Figure 2 Effect of miR-490-5p on proliferation and apoptosis of p815 mast cells.
A: Effect of miR-490-5p on proliferation of p815 mast cells, cell viability in the siRNA group was significantly reduced compared to the normal and null group (P < 0.05), there was no significant difference between the normal and null group; B: Mast cell apoptosis after transfection, in the normal group the mean apoptotic index was 15.86%, in the siRNA group the mean apoptotic index was 41.19%, in the null group the mean apoptotic index was 11.84% (n = 3).
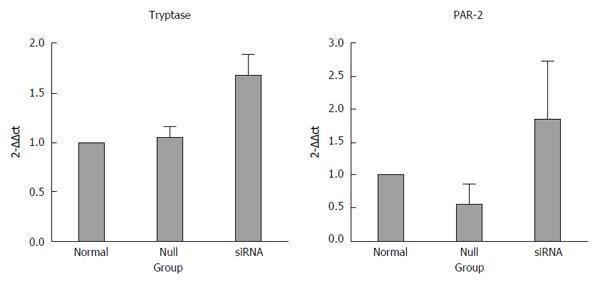
Figure 3 Quantification of tryptase and protease-activated receptor 2 mRNA after normalization to the housekeeping gene U6.
Significant elevation of tryptase and PAR-2 expression was observed in the siRNA group compared with the normal and null group (P < 0.05), and no difference was observed between the normal and null group. The fold change in mRNA expression was calculated relative to the endogenous U6 control using 2-ΔΔCt. The data are expressed as the mean ± SEM.
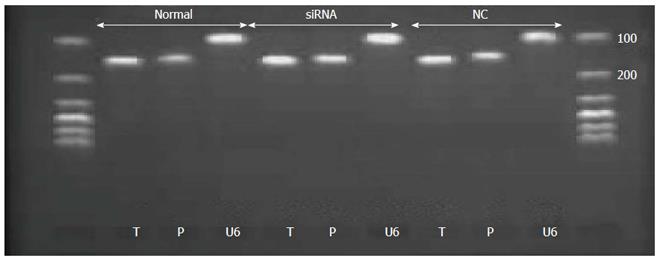
Figure 4 Polymerase chain reaction products were subjected to agarose gel electrophoresis.
All real-time-PCR products from the three groups migrated as expected. T: Tryptase 145 bp; P: Protease-activated receptor 2; 139 bp; U6: 106 bp.
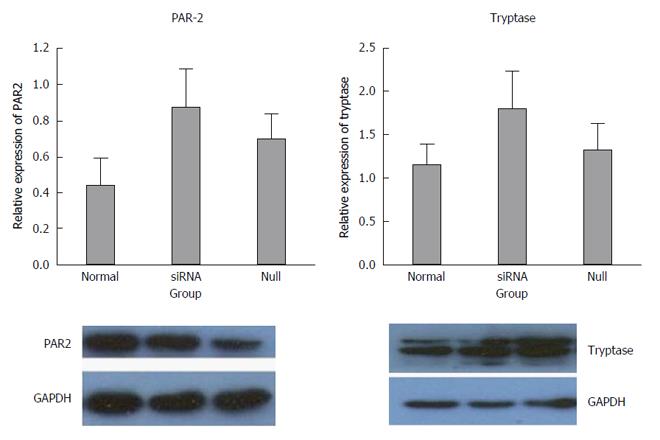
Figure 5 Expression of tryptase and protease-activated receptor 2 in p815 mast cells after silencing miR-490-5p.
The density of each group band was compared with the corresponding control band and normalized to the GAPDH gene. The level of PAR-2 increased in the siRNA group, but no significant difference was observed between the siRNA group and the controls (P > 0.05). The level of tryptase increased slightly in the siRNA group, but no significant difference was observed between the siRNA group and the controls (P > 0.05).
- Citation: Ren HX, Zhang FC, Luo HS, Zhang G, Liang LX. Role of mast cell-miR-490-5p in irritable bowel syndrome. World J Gastroenterol 2017; 23(1): 93-102
- URL: https://www.wjgnet.com/1007-9327/full/v23/i1/93.htm
- DOI: https://dx.doi.org/10.3748/wjg.v23.i1.93


