Copyright
©The Author(s) 2017.
World J Gastroenterol. Jan 7, 2017; 23(1): 93-102
Published online Jan 7, 2017. doi: 10.3748/wjg.v23.i1.93
Published online Jan 7, 2017. doi: 10.3748/wjg.v23.i1.93
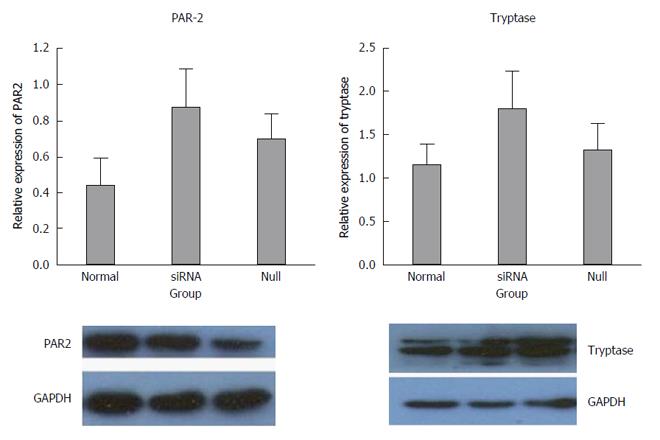
Figure 5 Expression of tryptase and protease-activated receptor 2 in p815 mast cells after silencing miR-490-5p.
The density of each group band was compared with the corresponding control band and normalized to the GAPDH gene. The level of PAR-2 increased in the siRNA group, but no significant difference was observed between the siRNA group and the controls (P > 0.05). The level of tryptase increased slightly in the siRNA group, but no significant difference was observed between the siRNA group and the controls (P > 0.05).
- Citation: Ren HX, Zhang FC, Luo HS, Zhang G, Liang LX. Role of mast cell-miR-490-5p in irritable bowel syndrome. World J Gastroenterol 2017; 23(1): 93-102
- URL: https://www.wjgnet.com/1007-9327/full/v23/i1/93.htm
- DOI: https://dx.doi.org/10.3748/wjg.v23.i1.93


