Copyright
©The Author(s) 2015.
World J Gastroenterol. Aug 28, 2015; 21(32): 9544-9553
Published online Aug 28, 2015. doi: 10.3748/wjg.v21.i32.9544
Published online Aug 28, 2015. doi: 10.3748/wjg.v21.i32.9544
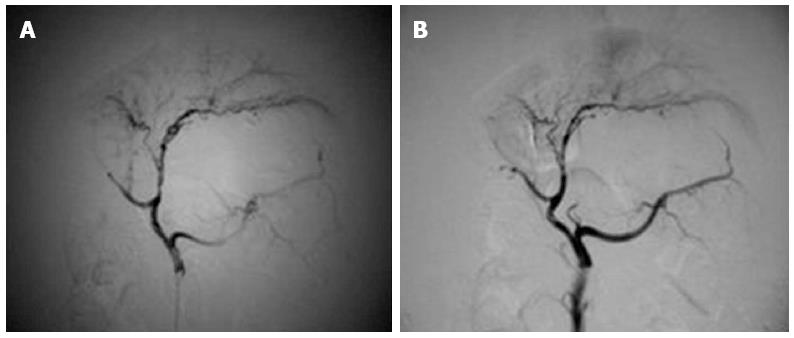
Figure 1 Hepatic artery variation.
A: Hepatic arteriography of experimental group 2 before perfusion showed good distribution of hepatic arteries and their branches; B: After hepatic arterial perfusion in experimental group 2, small peripheral branches of hepatic arteries were significantly reduced compared with before perfusion.
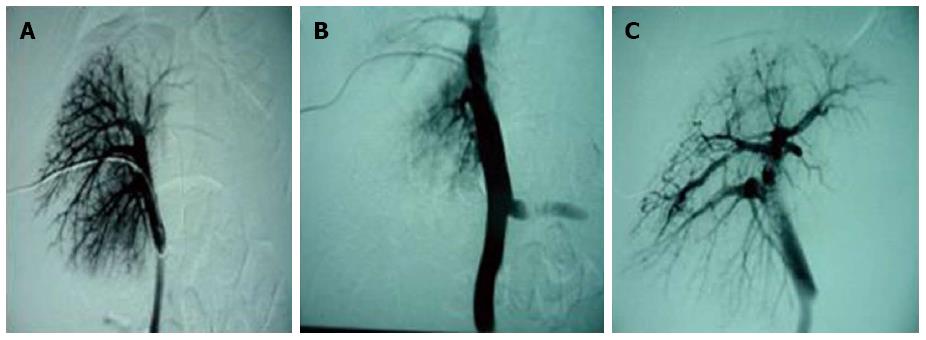
Figure 2 Portal vein variation.
A: Direct portal phlebography of experimental group 2 before perfusion showed the portal venous branches clearly; B: Portal phlebography immediately after perfusion showed a significant reduction in small portal venous branches and a widened main portal vein; C: Portal phlebography at 6 wk after perfusion showed that a large number of irregular bypass branches of intrahepatic portal veins were formed, which communicated directly with hepatic veins, and the main portal vein was still wider than that before perfusion.
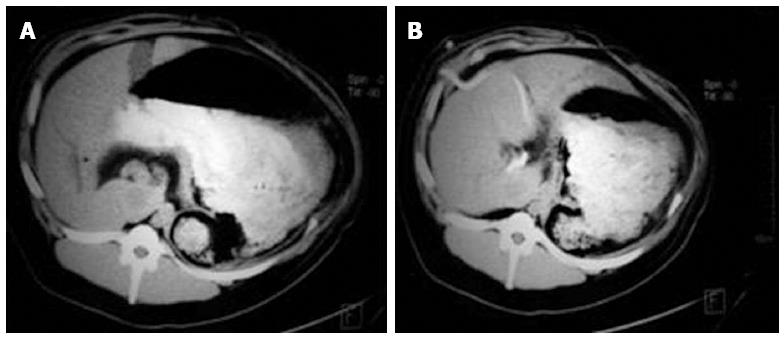
Figure 3 Liver size variation.
A: Computed tomography of experimental group 2 before perfusion demonstrating normal liver size; B: At 6 wk after perfusion, liver size was markedly increased.
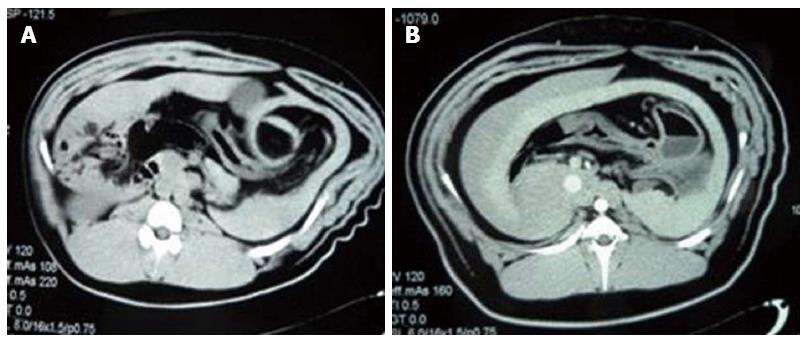
Figure 4 Spleen size variation.
A: Computed tomography of experimental group 2 before perfusion demonstrating normal spleen size and the spleen was thin and curled; B: At 6 wk after perfusion, spleen size was markedly increased; the spleen was not curled and extended into the hepatic fissure.
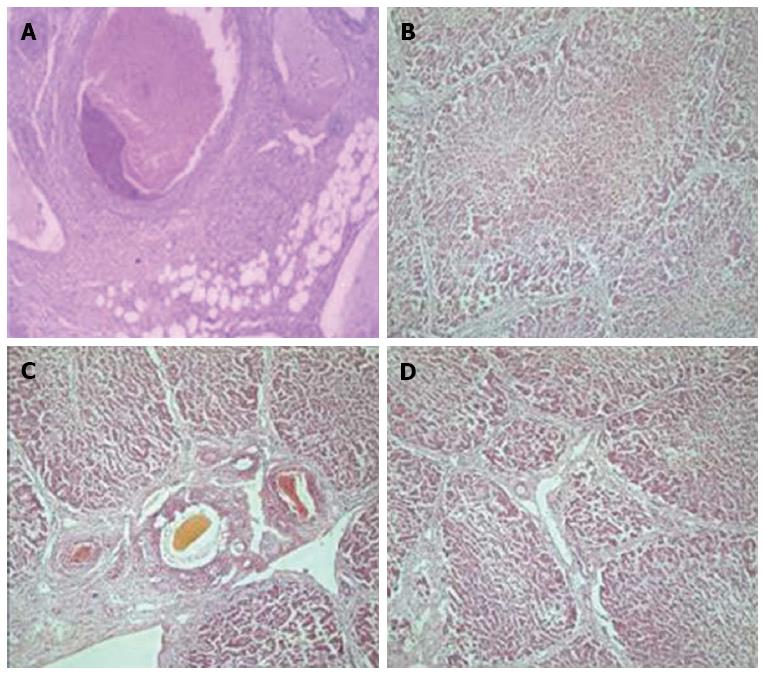
Figure 5 Pathological variation.
A: Within 6 h after perfusion in experimental group 2, thrombosis was evident in interlobular veins; B: At 2 wk after perfusion in experimental group 2, irregular, massive hepatocyte degeneration and necrosis were observed; C: At 4 wk after perfusion in experimental group 2, bile duct proliferation and dilation were evident; D: At 6 wk after perfusion in experimental group 2, pseudo-lobules formed with fibrous tissue proliferation and bridging fibrosis. Hematoxylin-eosin staining, magnification × 40 (A); × 200 (B-D).
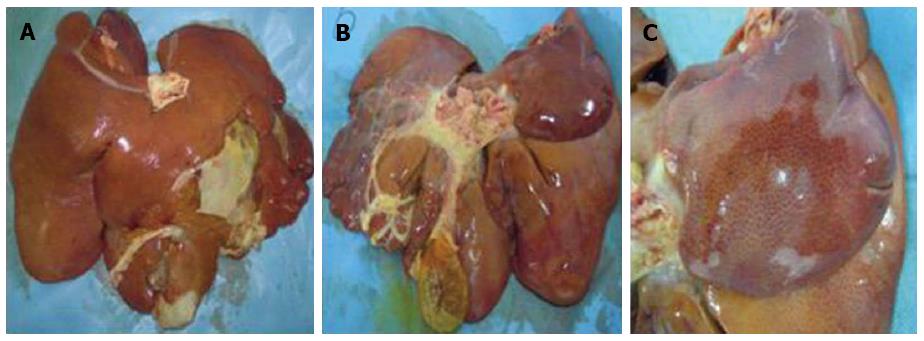
Figure 6 Gross sample of cirrhotic liver.
A, B: At 6 wk after perfusion in experimental group 2, gross samples of diaphragmatic and ventral liver showed that hepatic tissues were hard and had poor elasticity, and various liver lobes were enlarged; C: Local amplification of the gross sample showed that there were relatively uniform regenerative nodules on the liver surface.
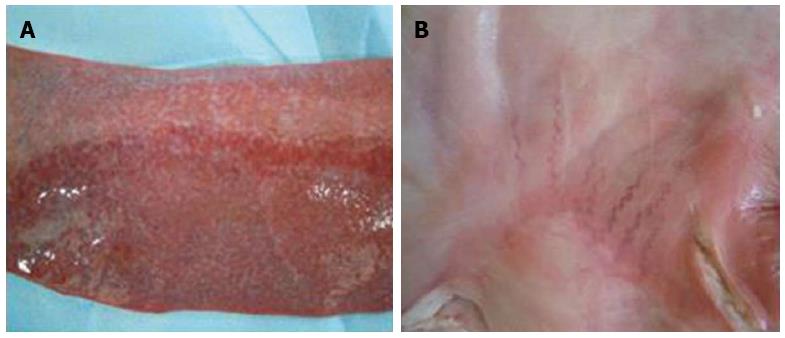
Figure 7 Gross sample of the spleen (A) and stomach (B).
A: At 6 wk after perfusion in experimental group 2, the gross sample of the spleen showed that the spleen was hard and congestive, and had a non-uniform color; B: At 6 wk after perfusion in experimental group 2, the gross sample of the stomach showed that there were small varicose veins on the stomach surface.
- Citation: Wang L, He FL, Liu FQ, Yue ZD, Zhao HW. Establishment of a hepatic cirrhosis and portal hypertension model by hepatic arterial perfusion with 80% alcohol. World J Gastroenterol 2015; 21(32): 9544-9553
- URL: https://www.wjgnet.com/1007-9327/full/v21/i32/9544.htm
- DOI: https://dx.doi.org/10.3748/wjg.v21.i32.9544


