Copyright
©2014 Baishideng Publishing Group Inc.
World J Gastroenterol. Dec 21, 2014; 20(47): 17851-17862
Published online Dec 21, 2014. doi: 10.3748/wjg.v20.i47.17851
Published online Dec 21, 2014. doi: 10.3748/wjg.v20.i47.17851
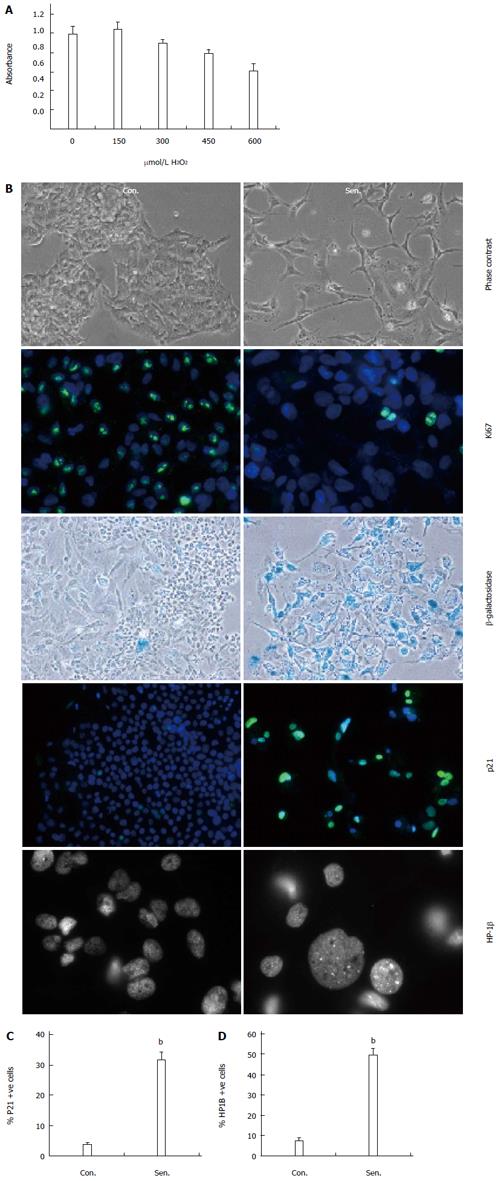
Figure 1 Stress-induced senescence in human hepatocytes.
A: HepG2 cells were treated with the indicated doses of hydrogen peroxide (H2O2) and survival assessed using a tetrazolium reduction assay; B: Phase contrast, Ki67 immunocytochemistry, β-galactosidase activity, p21 immunocytochemistry, and heterochromatin protein 1 beta (HP1β) immunocytochemistry in control (Con.) and H2O2-treated senescent (Sen.) HepG2 7 d after release from H2O2 treatment. All panels magnification × 200, except HP-1β magnification × 630; C: Quantification of p21+ nuclei; D: Quantification of cells with HP1β+ foci. Data are representative of at least 3 independent experiments. bP < 0.01 vs control group.
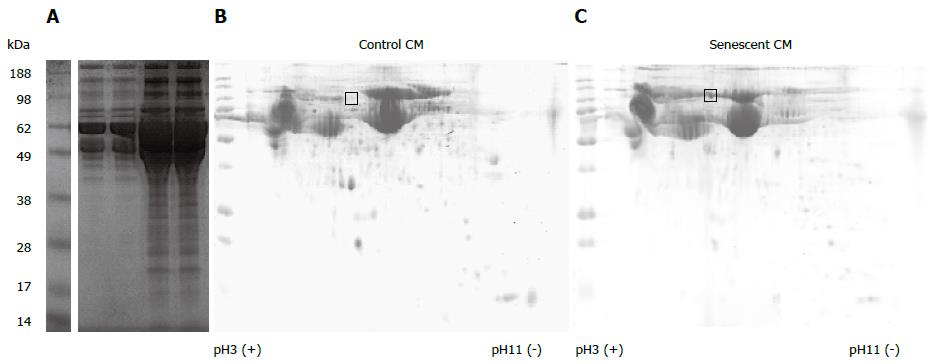
Figure 2 Secretory profile of control and senescent hepatocytes.
Proteins in conditioned media (CM) derived from an equivalent number of control (Con.) and senescent (Sen.) hepatocytes were separated by 1-dimensional polyacrylamide gel electrophoresis (PAGE) (A). 150 μg protein from control (B) and senescent (C) hepatocyte conditioned media was separated by 2-dimensional PAGE. Gels were stained with colloidal coomassie. The gel region excised for liquid chromatography mass spectrometry services analysis is indicated. Gel images are representative of 2 independent experiments.
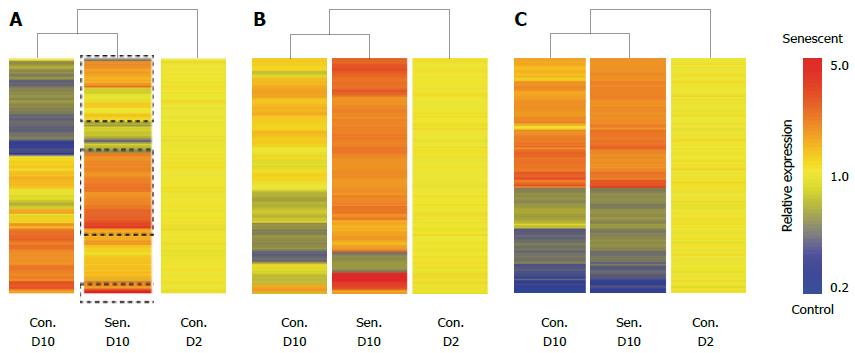
Figure 3 Senescent hepatocyte gene expression signature.
Senescent hepatocytes (Sen.) were compared to untreated hepatocytes (Con.) at D (Day) 2 and D10 of the experimental protocol by illumina microarray. A: Hierarchical clustering of probes that were differentially expressed between control and senescent hepatocytes at D10; B: Hierarchical clustering of probes that were uniquely regulated in senescent hepatocytes; C: Hierarchical clustering of probes that were commonly regulated in senescent hepatocytes and untreated hepatocytes between D2 and D10. Probes are clustered by distance correlation with average linkage.
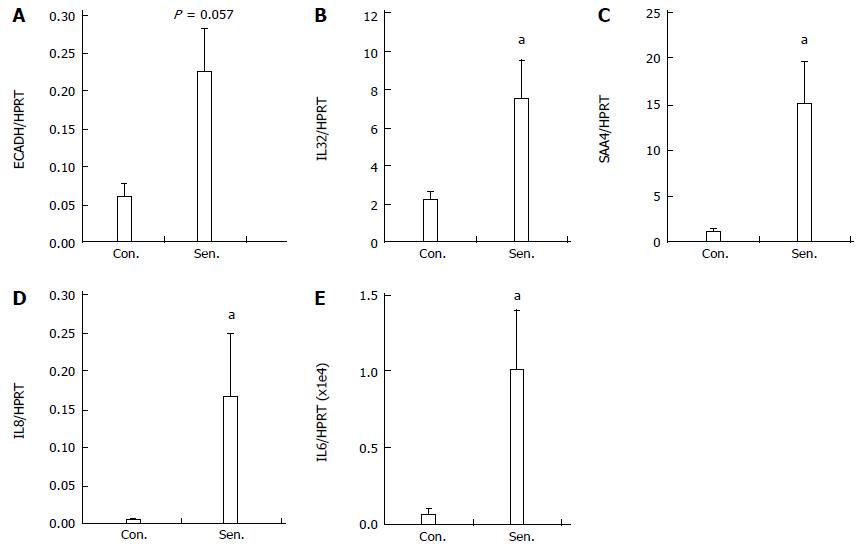
Figure 4 Quantitative polymerase chain reaction validation of microarray.
Relative mRNA expression of A: ECADH; B: IL32; C: IL8; D: SAA4 and E: IL6 in control (Con.) and senescent (Sen.) hepatocytes was quantified by real-time polymerase chain reaction PCR. Data represent mean + SEM, n = 4 independent experiments. aP < 0.05 vs control group.
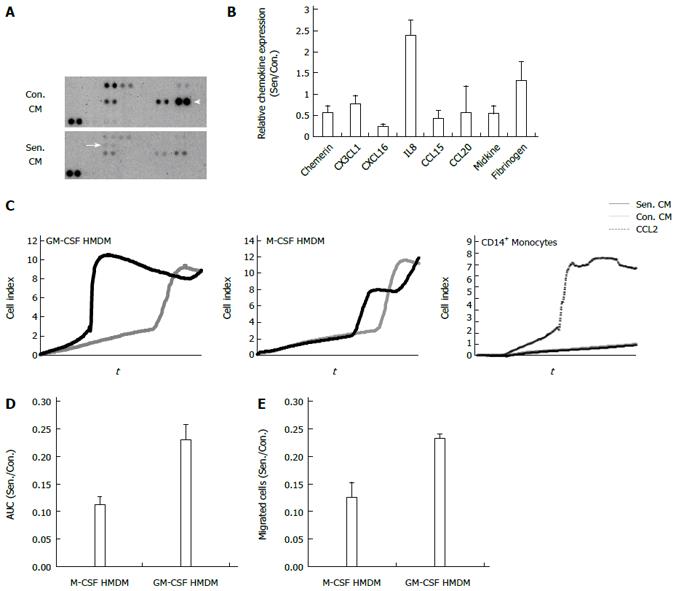
Figure 5 Chemokine profile and chemotactic effects of senescent hepatocyte conditioned medium.
A: Representative human chemokine array. Arrow: IL8. Arrow head: CCL20; B: Relative protein expression in control and senescent conditioned medium (CM). Data show the average + range of 2 independent experiments; C: Representative xCELLigence trace, macrophage and monocyte migration in response to control and senescent CM and recombinant CC chemokine ligand 2 (CCL2); D: Relative migration of macrophage colony stimulating factor (M-CSF) and granulocyte macrophage colony stimulating factor (GM-CSF)-derived human monocyte derived macrophages (HMDM) in senescent (Sen.) compared to control (Con.) CM in D: xCELLigence assay quantified by the area under the curve (AUC); E: Transwell assay, quantified by counting migrated nuclei. Data represent mean + SE.
- Citation: Irvine KM, Skoien R, Bokil NJ, Melino M, Thomas GP, Loo D, Gabrielli B, Hill MM, Sweet MJ, Clouston AD, Powell EE. Senescent human hepatocytes express a unique secretory phenotype and promote macrophage migration. World J Gastroenterol 2014; 20(47): 17851-17862
- URL: https://www.wjgnet.com/1007-9327/full/v20/i47/17851.htm
- DOI: https://dx.doi.org/10.3748/wjg.v20.i47.17851


