
















©2014 Baishideng Publishing Group Inc.
World J Gastroenterol. Dec 21, 2014; 20(47): 17851-17862
Published online Dec 21, 2014. doi: 10.3748/wjg.v20.i47.17851
Published online Dec 21, 2014. doi: 10.3748/wjg.v20.i47.17851
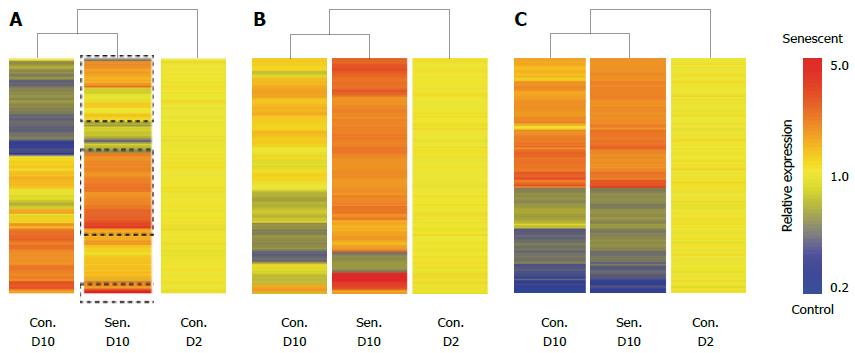
Figure 3 Senescent hepatocyte gene expression signature.
Senescent hepatocytes (Sen.) were compared to untreated hepatocytes (Con.) at D (Day) 2 and D10 of the experimental protocol by illumina microarray. A: Hierarchical clustering of probes that were differentially expressed between control and senescent hepatocytes at D10; B: Hierarchical clustering of probes that were uniquely regulated in senescent hepatocytes; C: Hierarchical clustering of probes that were commonly regulated in senescent hepatocytes and untreated hepatocytes between D2 and D10. Probes are clustered by distance correlation with average linkage.
- Citation: Irvine KM, Skoien R, Bokil NJ, Melino M, Thomas GP, Loo D, Gabrielli B, Hill MM, Sweet MJ, Clouston AD, Powell EE. Senescent human hepatocytes express a unique secretory phenotype and promote macrophage migration. World J Gastroenterol 2014; 20(47): 17851-17862
- URL: https://www.wjgnet.com/1007-9327/full/v20/i47/17851.htm
- DOI: https://dx.doi.org/10.3748/wjg.v20.i47.17851