Copyright
©2012 Baishideng Publishing Group Co.
World J Gastroenterol. May 14, 2012; 18(18): 2280-2286
Published online May 14, 2012. doi: 10.3748/wjg.v18.i18.2280
Published online May 14, 2012. doi: 10.3748/wjg.v18.i18.2280
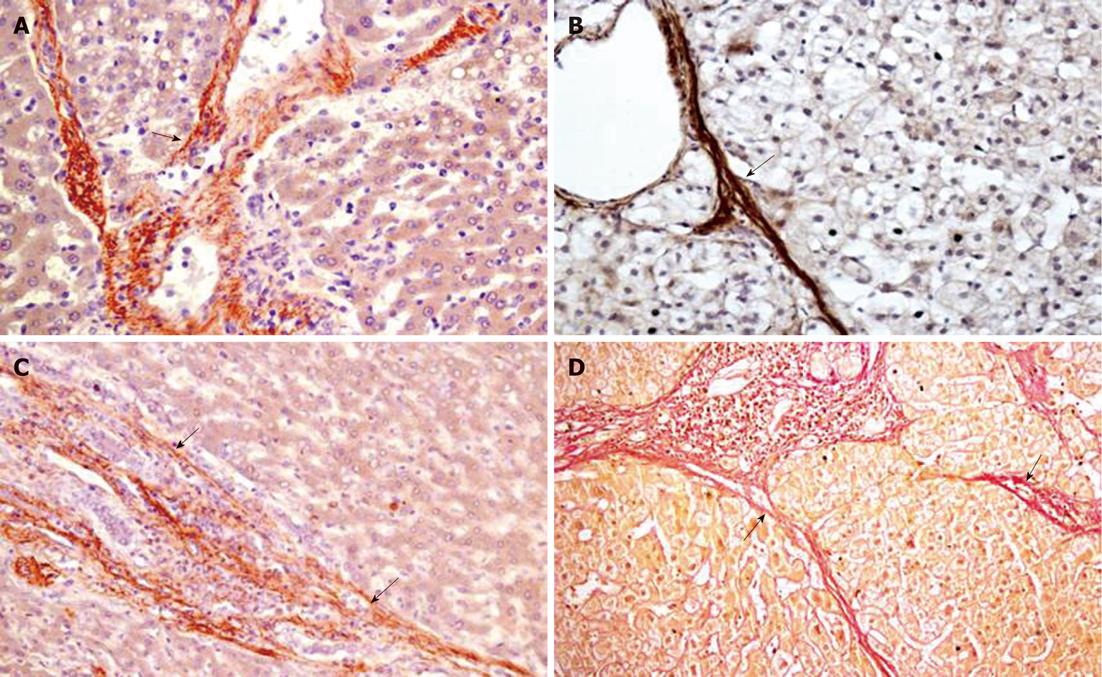
Figure 1 Production of connective tissue growth factor or transforming growth factor β-1 in fibrous septa of hepatitis B virus-infected livers.
Connective tissue growth factor mRNA (A) or protein (B) were detected by in situ hybridization (ISH) or immunohistochemistry respectively. transforming growth factor β-1 mRNA (C) was detected by ISH while collagen bundles (D) were stained red using Van Gieson’s method. Original magnification, × 200 in A, B, C and D. Examples of positively stained cells or structures in each panel are arrowed.
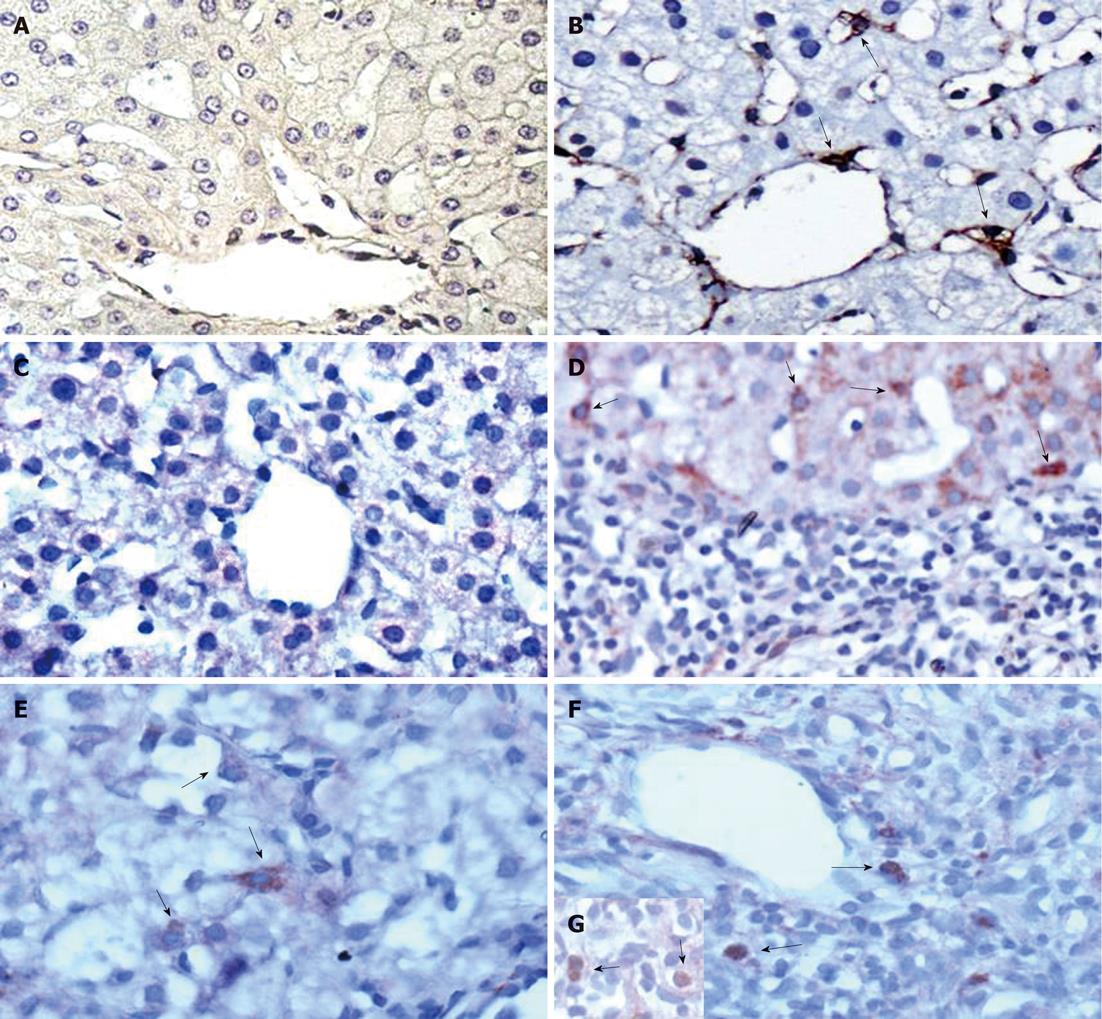
Figure 2 Cellular localization of key fibrotic markers in hepatitis B virus -induced liver fibrosis.
α-SMA-positive hepatic stellate cells (HSCs) were not detectable in hepatitis B virus carriers who had normal liver histology (A) but were present in chronic hepatitis B (CHB) liver (B). In CHB liver samples, there was no staining when the in situ hybridization probes were omitted (C) but their inclusion demonstrated the presence of either connective tissue growth factor mRNA in activated HSCs (D) or transforming growth factor β-1 mRNA in activated HSCs (E) or Kupffer cells (F). F4/80 antigen-positive Kupffer cells (G). Original magnification, × 400 in A-G. Examples of postively stained cells in each panel are arrowed.
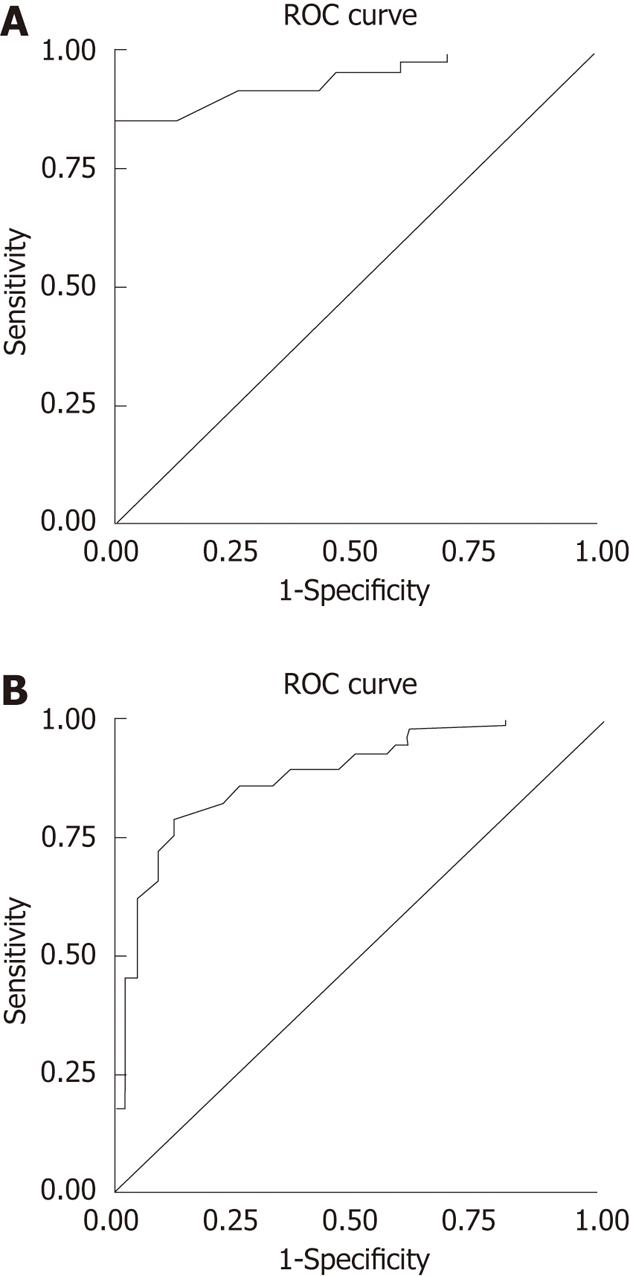
Figure 3 Receiver operating characteristic curve of connective tissue growth factor.
Receiver operating characteristic (ROC) curves of connective tissue growth factor distinguishing normal liver controls from patients with F1 stage liver fibrosis (A) or discriminating between mild and significant fibrosis (B) with areas under the ROC curves of 0.94 or 0.85, respectively.
- Citation: Piao RL, Brigstock DR, Zhu J, Zhang ML, Gao RP. Clinical significance of connective tissue growth factor in hepatitis B virus-induced hepatic fibrosis. World J Gastroenterol 2012; 18(18): 2280-2286
- URL: https://www.wjgnet.com/1007-9327/full/v18/i18/2280.htm
- DOI: https://dx.doi.org/10.3748/wjg.v18.i18.2280


