Copyright
©2010 Baishideng.
World J Gastroenterol. Feb 28, 2010; 16(8): 966-972
Published online Feb 28, 2010. doi: 10.3748/wjg.v16.i8.966
Published online Feb 28, 2010. doi: 10.3748/wjg.v16.i8.966
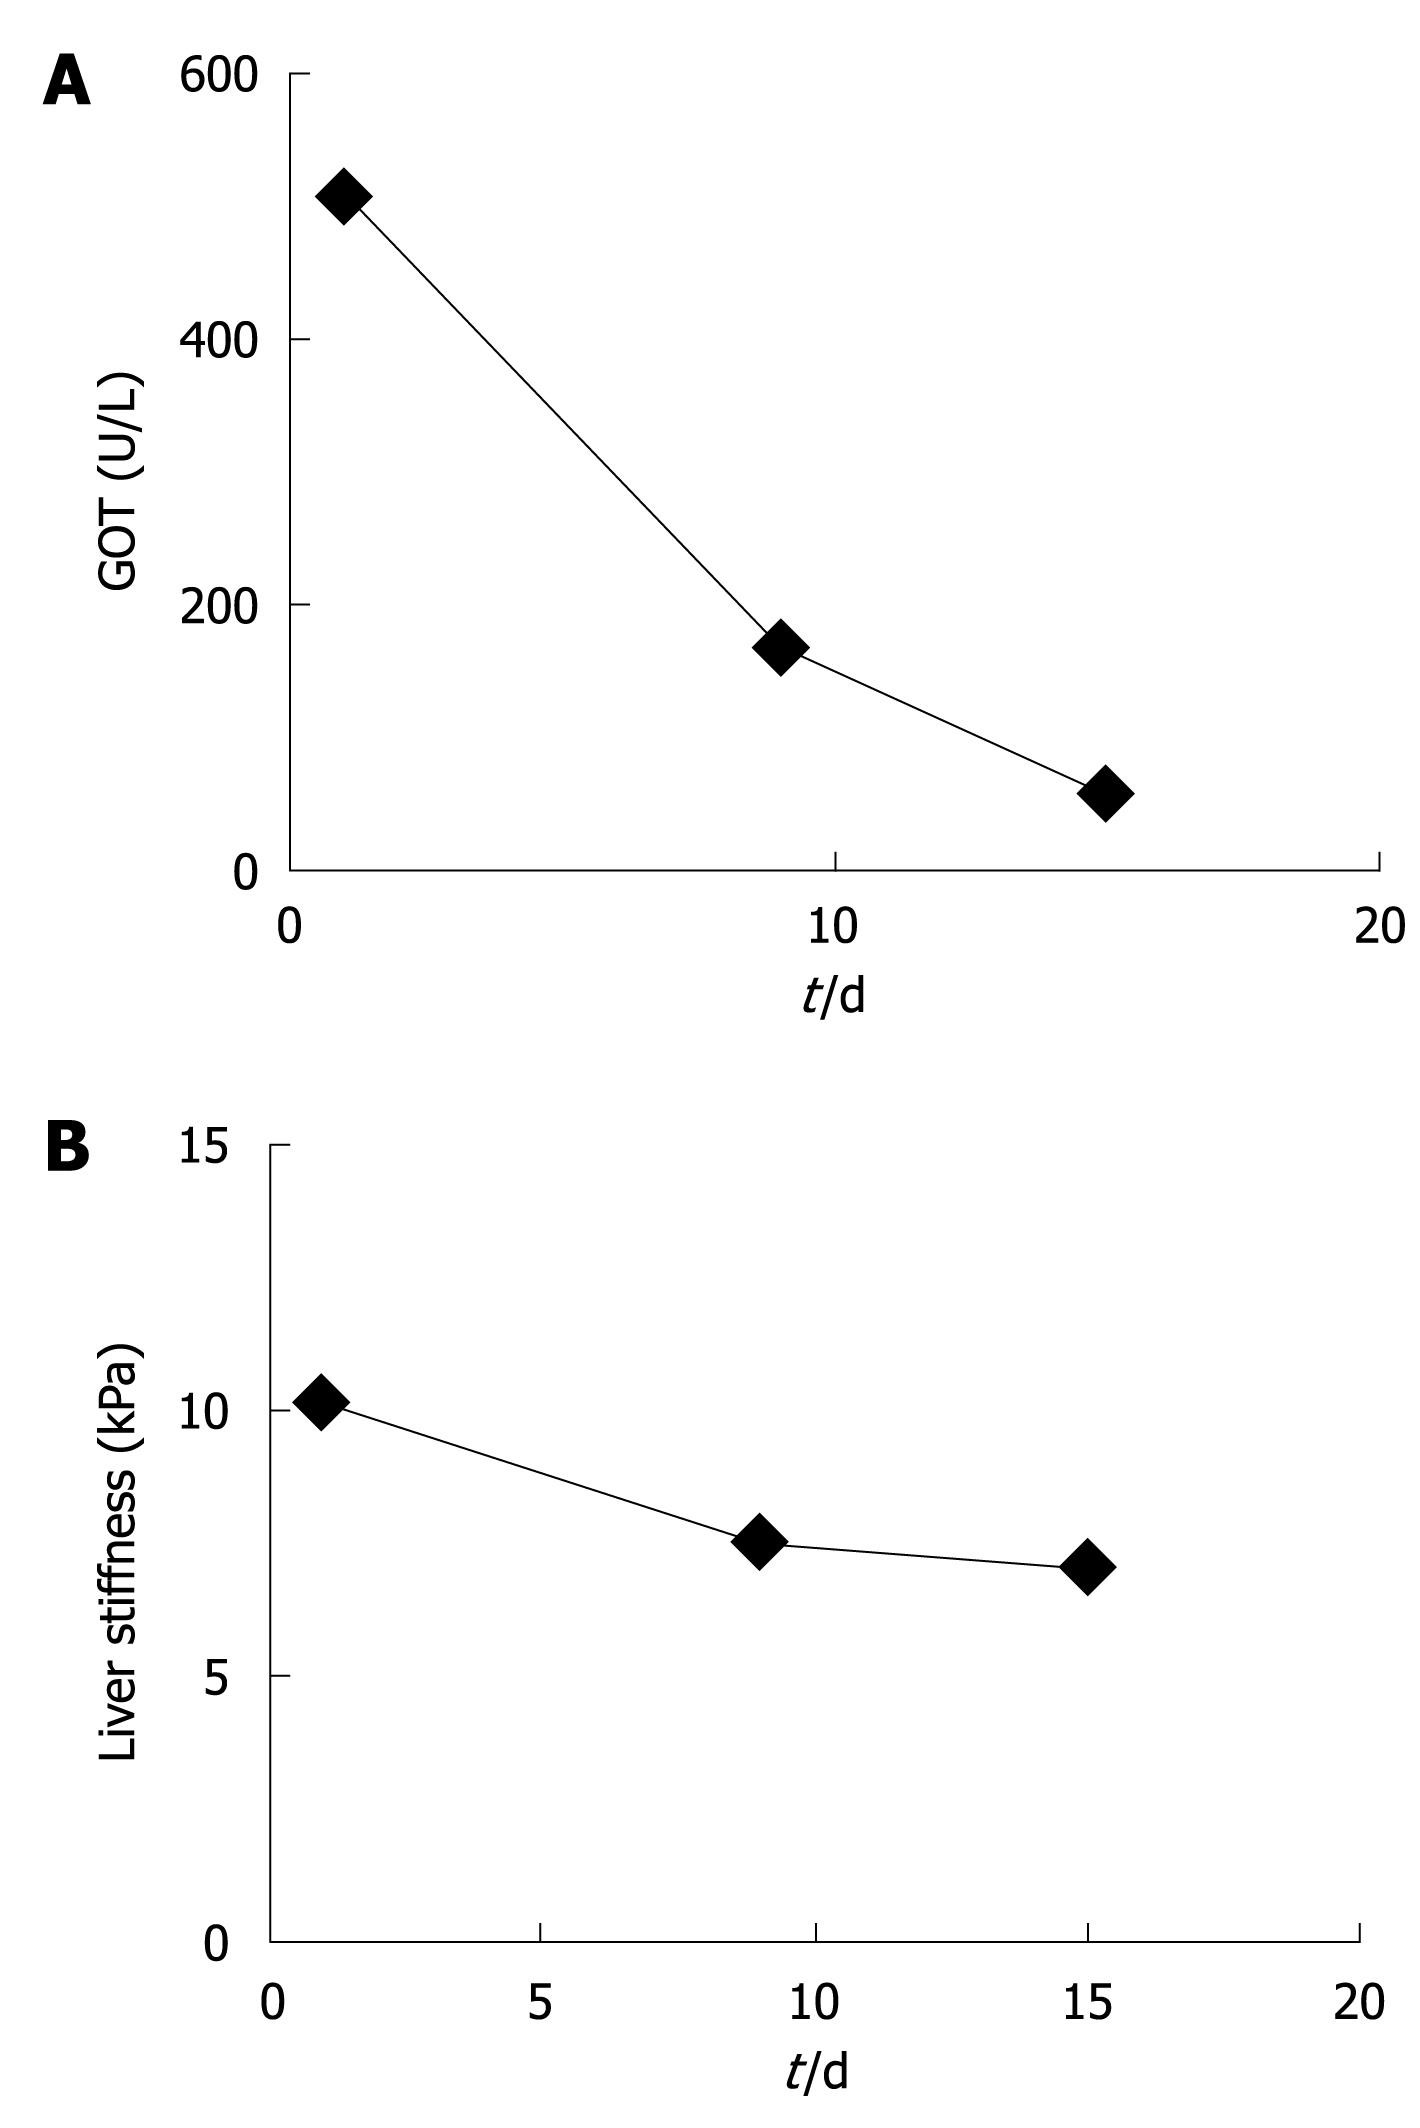
Figure 1 Changes in liver stiffness (LS) in a single patient with severe alcoholic liver disease (ALD) during alcohol detoxification.
Upon alcohol withdrawal, GOT (A) almost normalized and LS (B) decreased by more than 3 kPa. LS eventually remained stable at ca. 7 kPa corresponding well with the histologically confirmed F2 fibrosis stage.
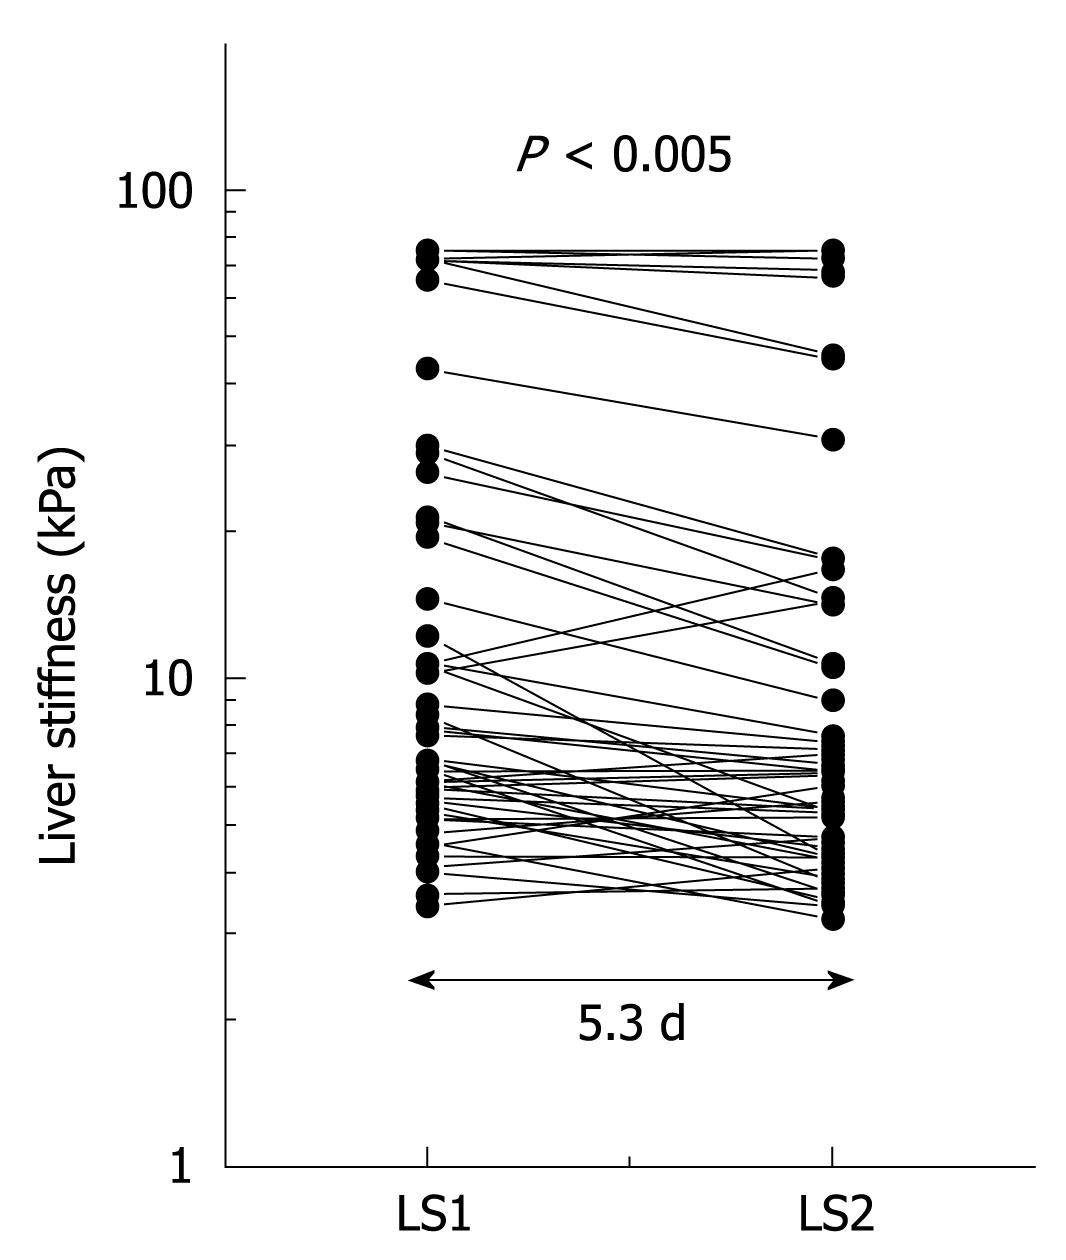
Figure 2 Sequential analysis of LS in 50 ALD patients following alcohol withdrawal over a mean observation period of 5.
3 d. LS decreased in almost all patients during alcohol detoxification. A semilogarithmic plot was chosen to better visualize and compare changes in LS at various initial levels.
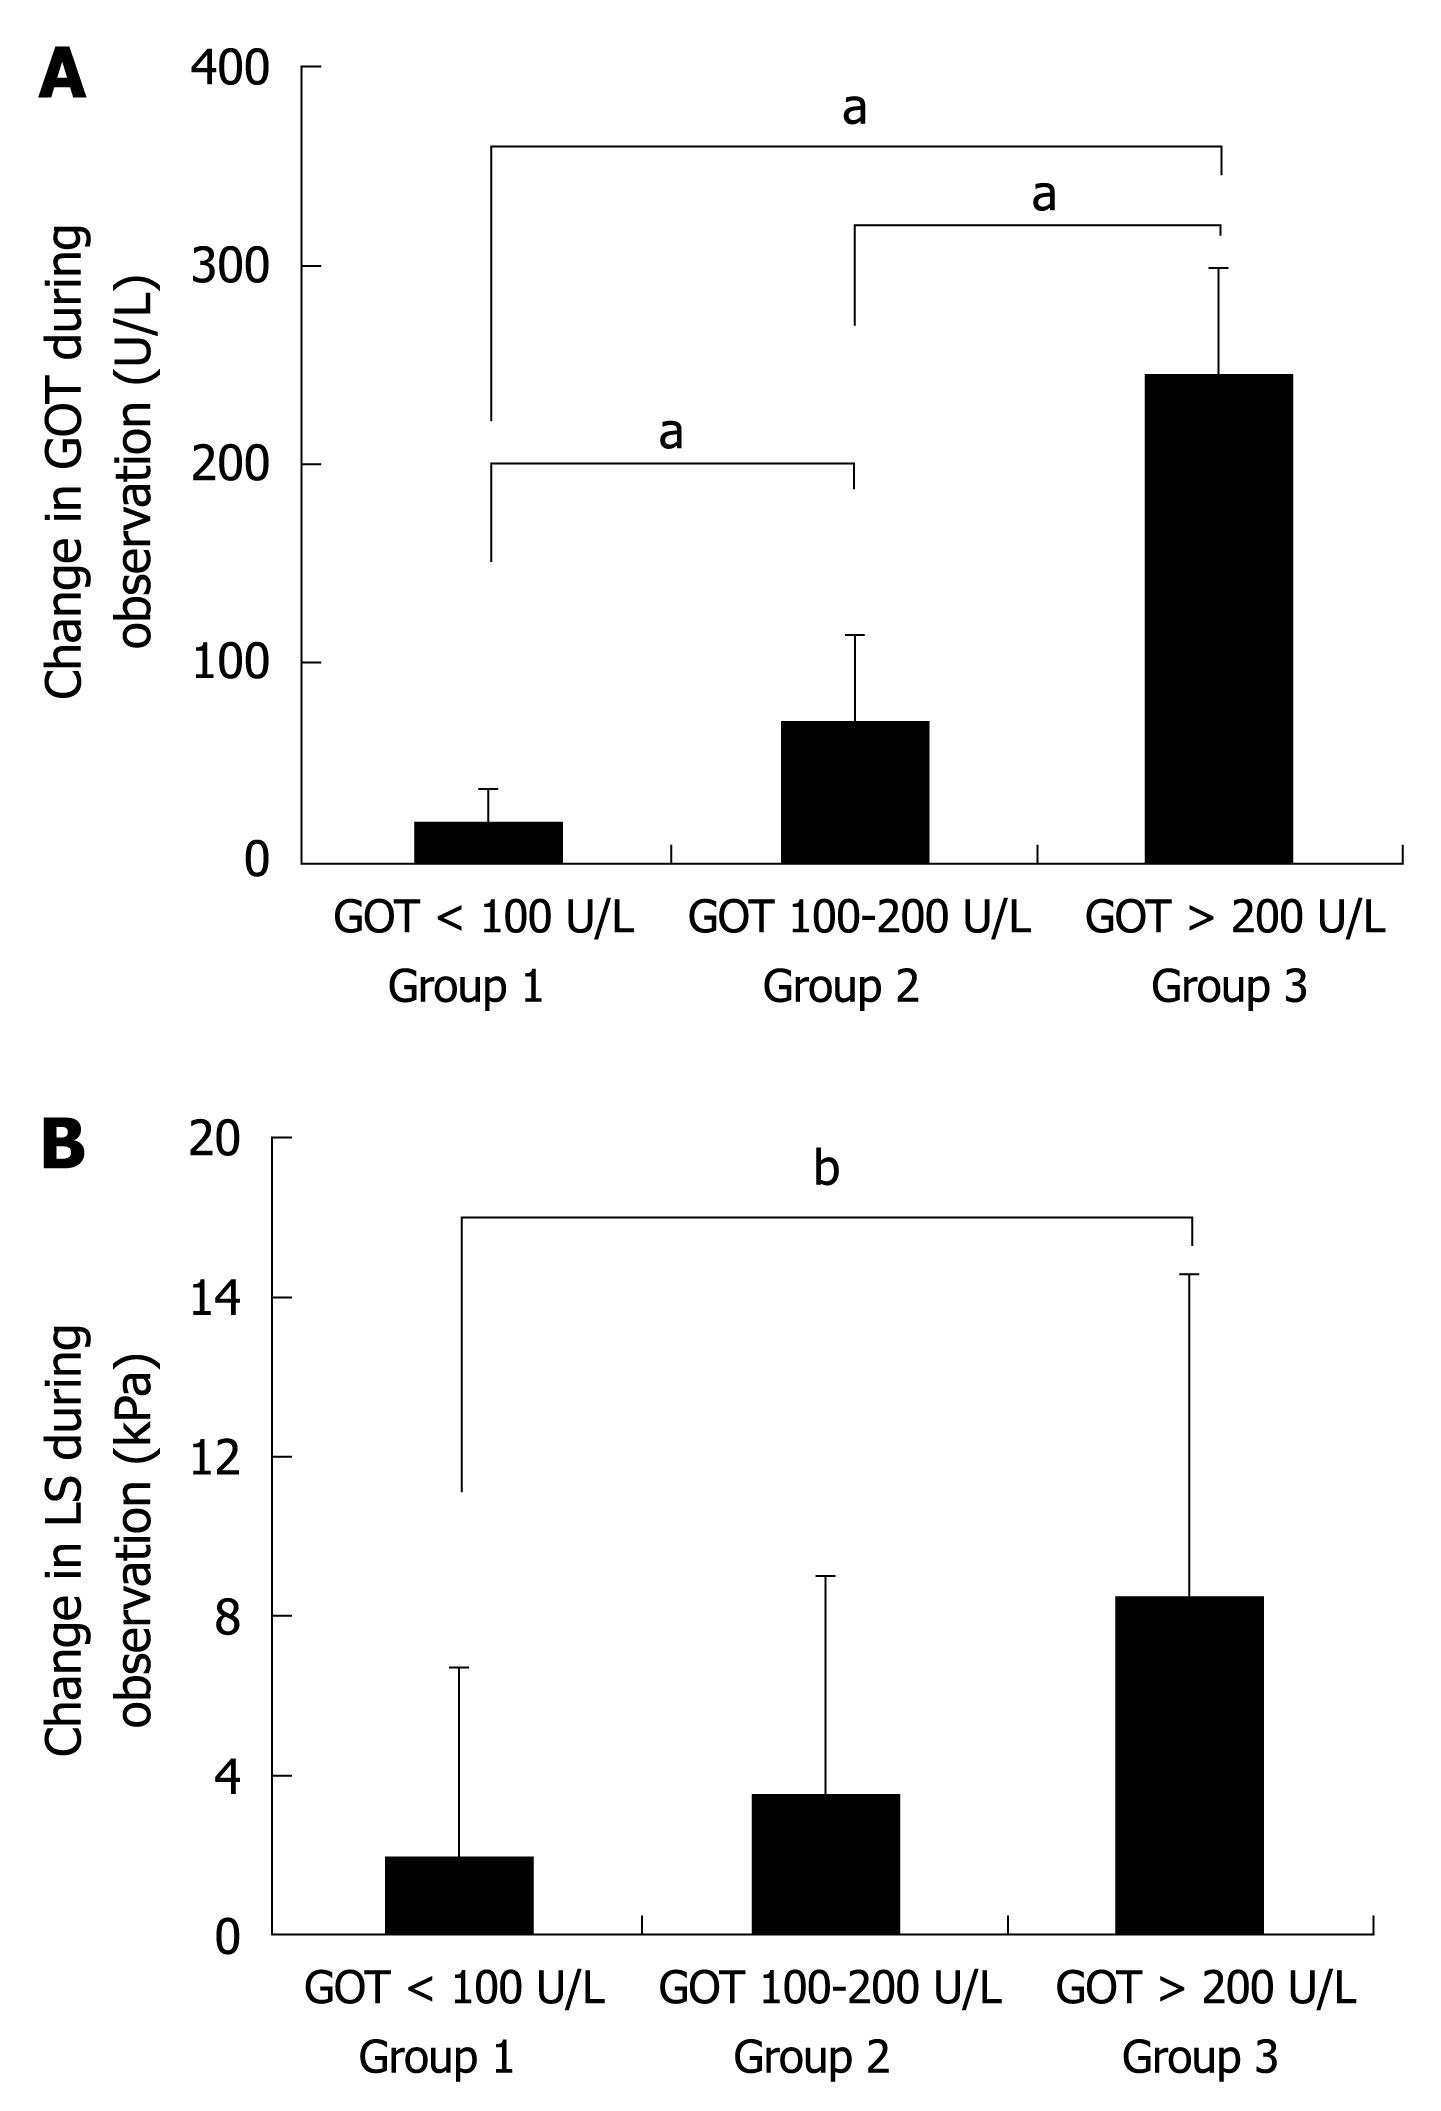
Figure 3 Decrease in LS depends on the mean decrease in GOT levels (steatohepatitis) during alcohol withdrawal.
A: Group 1 to 3 differ significantly (aP < 0.05) with regard to the mean decrease in GOT during alcohol withdrawal. Group 1 included patients with severe alcoholic steatohepatitis and GOT levels > 200 U/L; group 2 included patients with GOT values between 100 and 200 U/L; group 3 were patients with GOT values < 100 U/L. B: LS decreased by 8.4, 3.5 and 1.8 kPa, respectively, with a significant difference between groups 1 and 3 (bP < 0.01) (details in text).
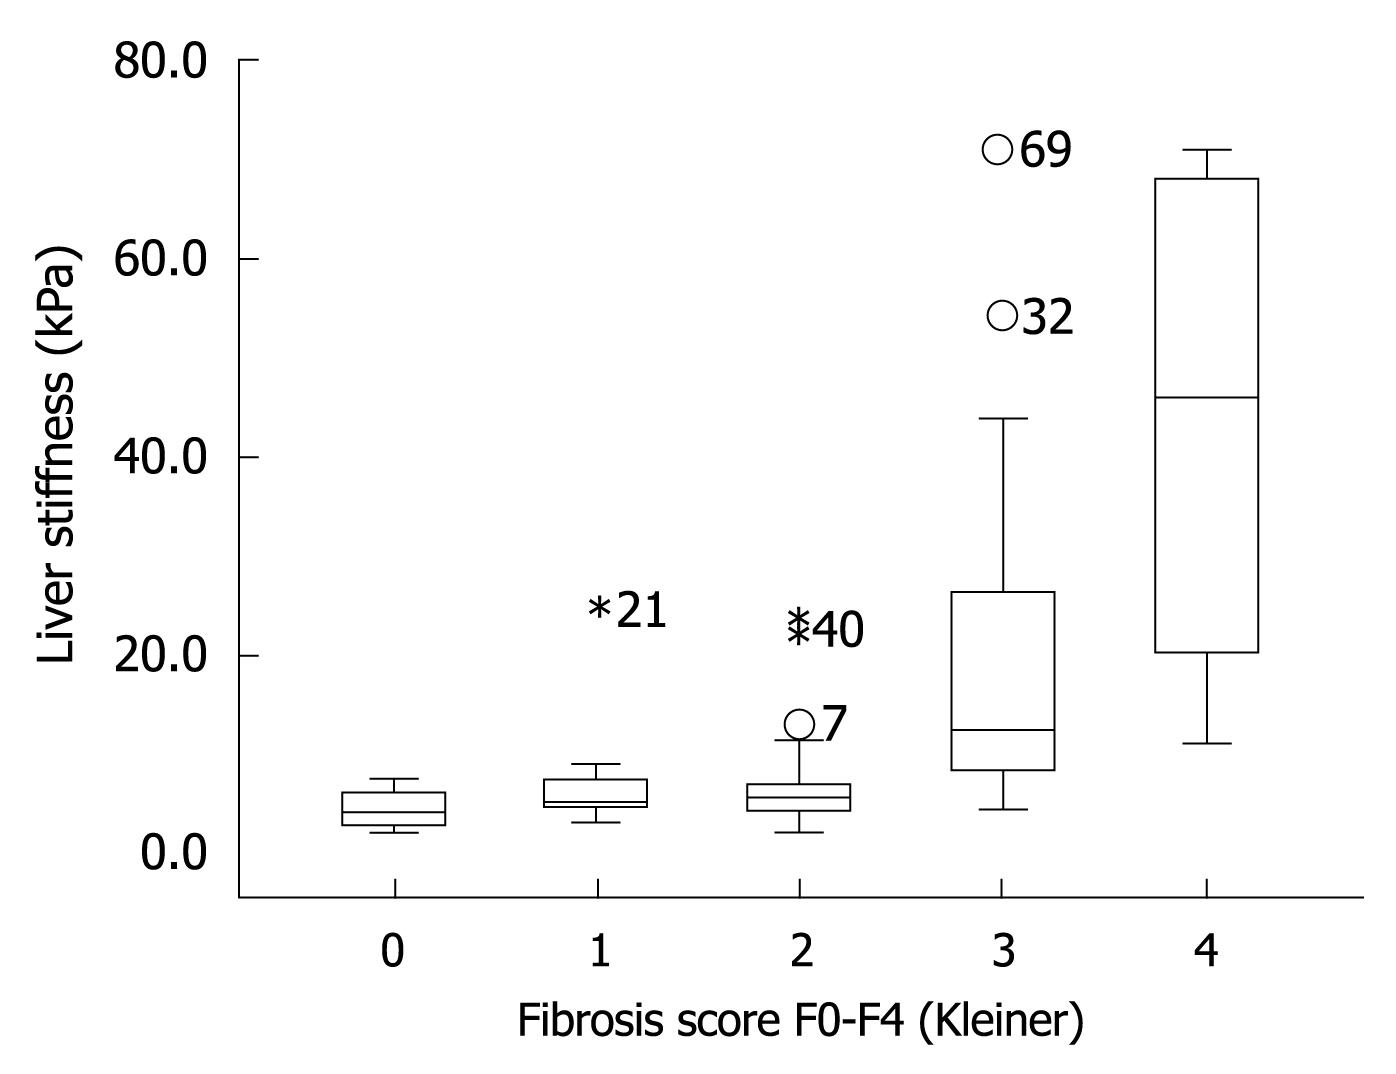
Figure 4 Box blot showing LS as a function of fibrosis stages F0-F4.
A significant increase in LS is seen from fibrosis stage F3 onwards. The length of the box represents the interquartile range within which 50% of the values were located. The line through the middle of each box represents the median. The error bars show the minimum and maximum values (range). Numbered symbols represent out-of-range patients excluded by the box plot.
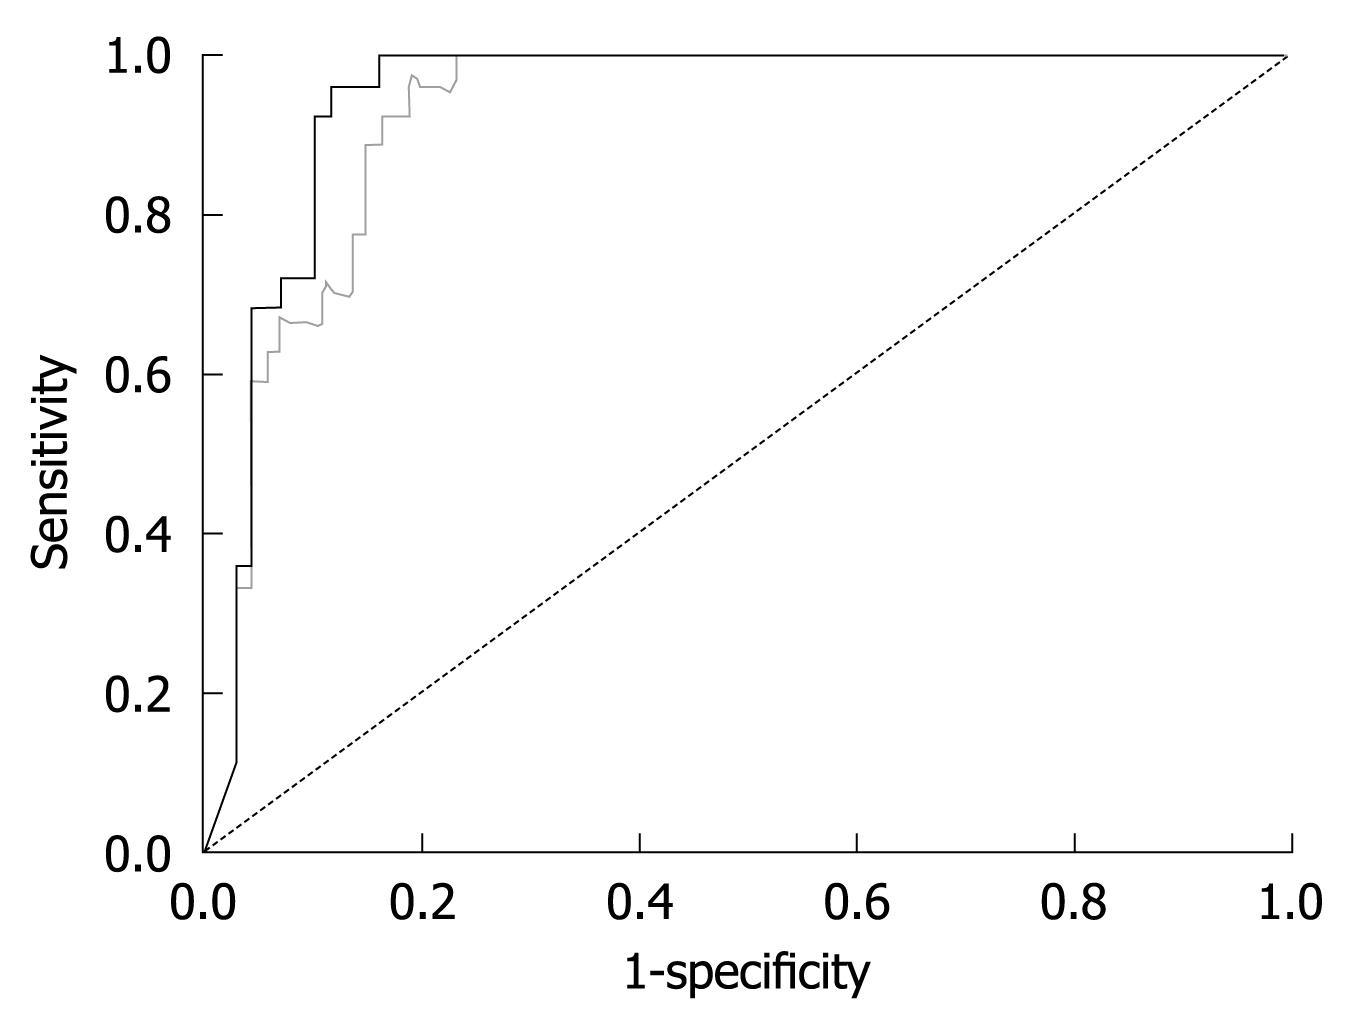
Figure 5 Receiver operating characteristic curves (ROC) for LS in patients with F4 fibrosis (liver cirrhosis) before (gray) and after (black) exclusion of patients with GOT > 100 U/L.
The areas under the ROC (AUROC) curve are given in Table 2.
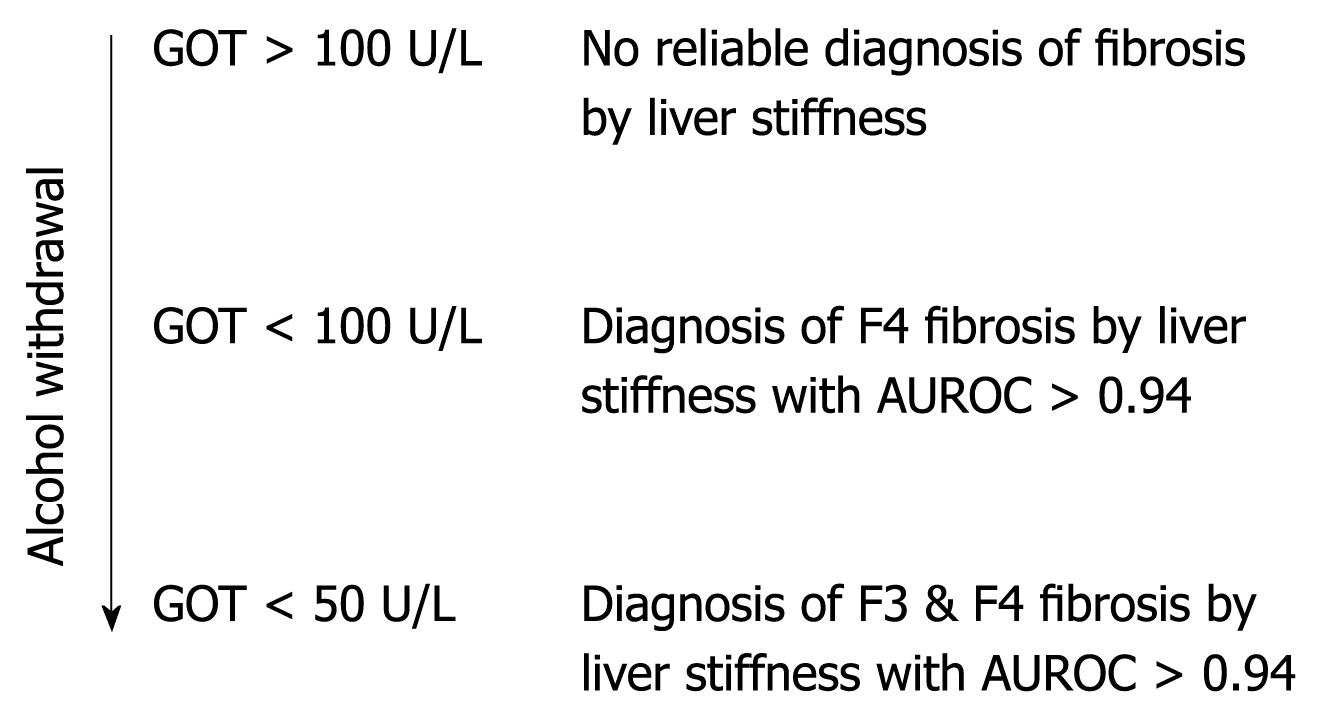
Figure 6 Proposed algorithm for the noninvasive assessment of fibrosis by FibroScan in patients with ALD.
GOT levels are used as criteria to exclude ongoing steatohepatitis that may falsely increase LS diagnosis independent of fibrosis stage. F4 cirrhosis can be detected by FibroScan with high accuracy if restricted to patients with GOT levels < 100 U/L. F3 fibrosis stage can be assessed with comparable accuracy if restricted to patients with GOT < 50 U/L (details in text).
- Citation: Mueller S, Millonig G, Sarovska L, Friedrich S, Reimann FM, Pritsch M, Eisele S, Stickel F, Longerich T, Schirmacher P, Seitz HK. Increased liver stiffness in alcoholic liver disease: Differentiating fibrosis from steatohepatitis. World J Gastroenterol 2010; 16(8): 966-972
- URL: https://www.wjgnet.com/1007-9327/full/v16/i8/966.htm
- DOI: https://dx.doi.org/10.3748/wjg.v16.i8.966


