Copyright
©2010 Baishideng Publishing Group Co.
World J Gastroenterol. Dec 21, 2010; 16(47): 5993-6000
Published online Dec 21, 2010. doi: 10.3748/wjg.v16.i47.5993
Published online Dec 21, 2010. doi: 10.3748/wjg.v16.i47.5993
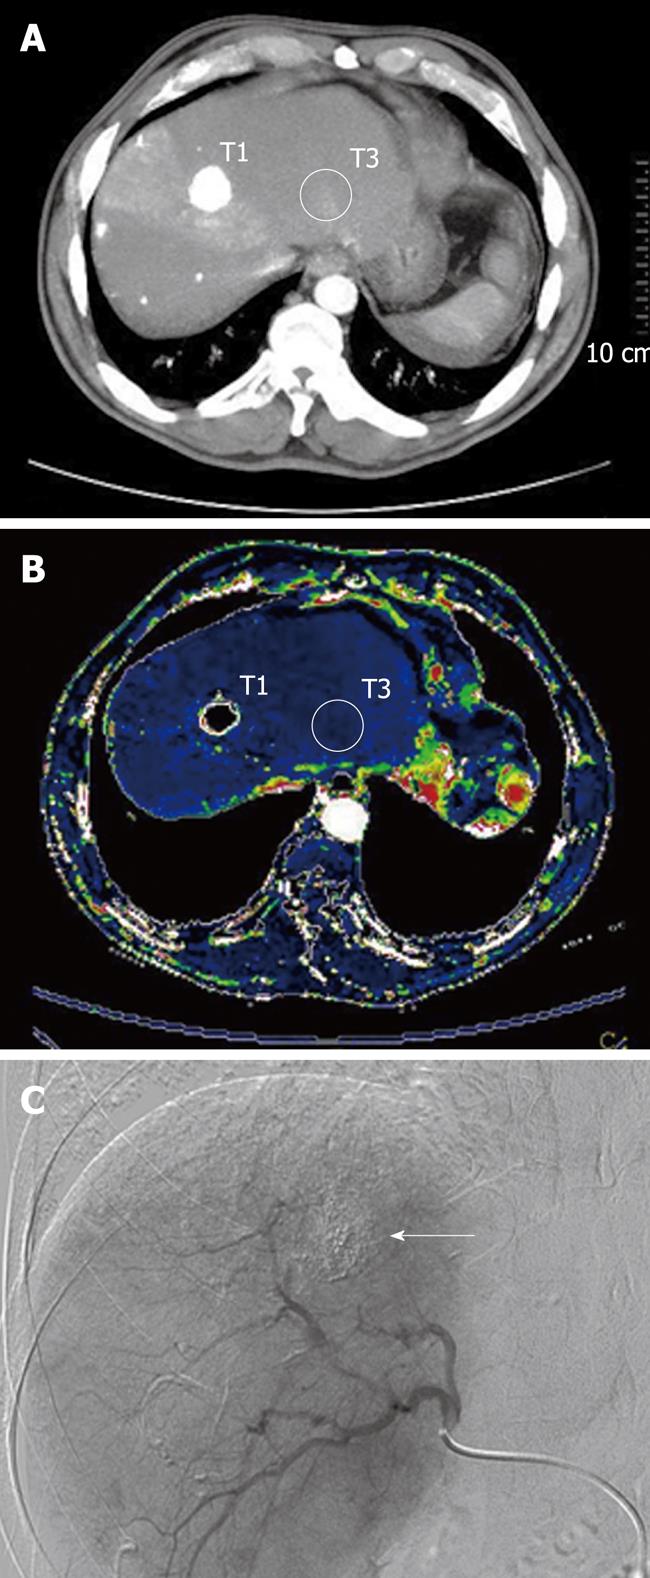
Figure 1 A 69-year-old man with Child A liver cirrhosis and 12 mm lesion of hepatocellular carcinoma, treated with transarterial chemoembolization, in the seventh segment of the liver that underwent computed tomography-perfusion study.
A: Multiphasic multidetector computed tomography scan image shows two hand drawn regions of interest (ROIs): T1 positioned on the successfully treated tumor contouring the treated area; T3 positioned on the surrounding liver parenchyma avoiding vessel structures, in order to obtain the quantitative perfusion data of the regions; B: Functional arterial perfusion colour map shows an homogenous distribution of perfusion area, with decreased perfusion range of colors compared with the background liver parenchyma; ROIs were positioned at the same level, on the successfully treated tumor (T1) and on the surrounding liver parenchyma (T3); C: Post chemoembolization digital fluoroscopic image obtained in the same patient shows excellent distribution of the lipiodol-chemotherapy mixture (arrow).
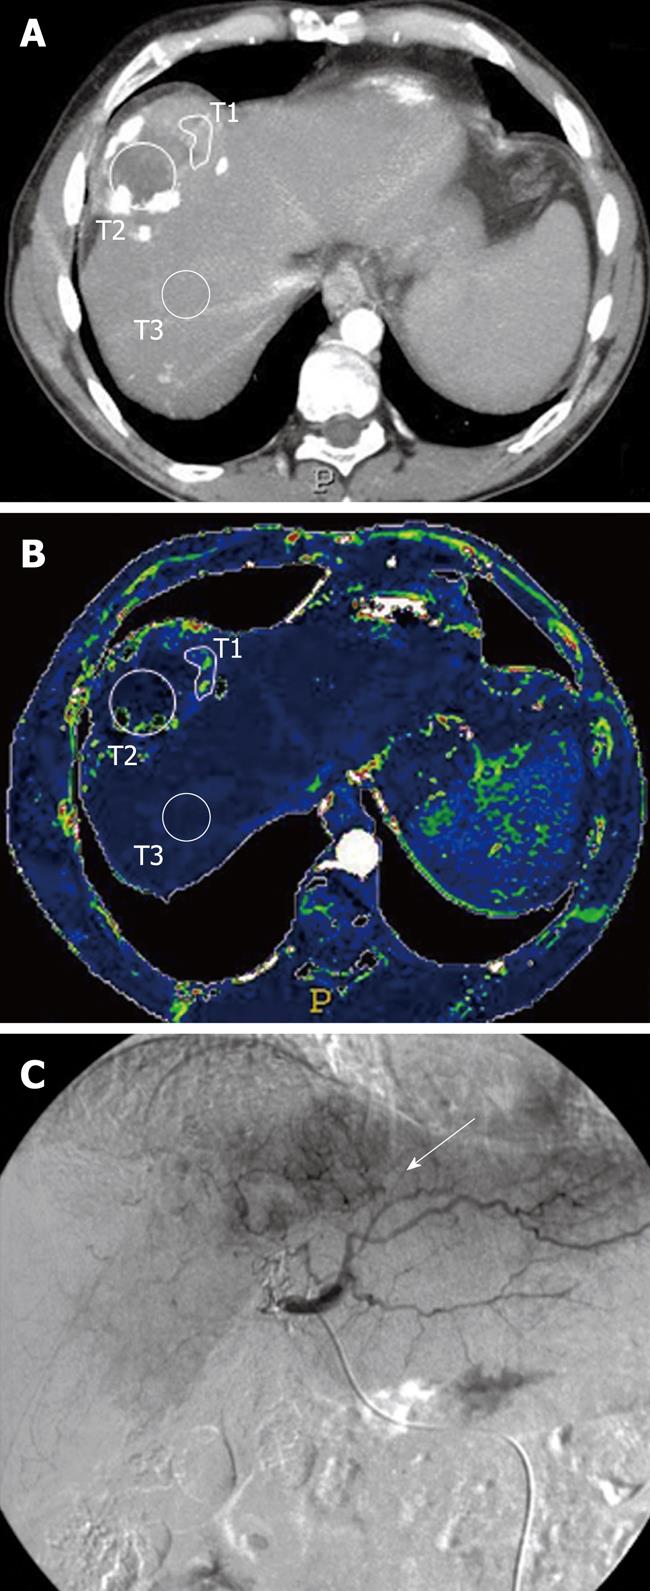
Figure 2 A 57-year-old man with Child B liver cirrhosis and 42 mm lesion of hepatocellular carcinoma in the fourth segment of the liver that underwent computed tomography-perfusion study.
A: Transverse data raw multiphasic multidetector computed tomography scan image shows regions of interest (ROIs) positioned on the periphery of lesion (T2), and on the primary lesion without relapse (T1) and on the surrounding liver parenchyma (T3) avoiding vessel structures, in order to obtain the quantitative perfusion data of the regions; B: Functional arterial perfusion colour map shows that the distribution of perfusion in the treated lesion is heterogeneous, with a different range of colours of residual disease (T1) compared with primary lesion without relapse (T2) that reveal the unsuccessful treatment of transarterial chemoembolization; ROIs were also positioned at the same level in surrounding liver parenchyma (T3); C: Post chemoembolization digital fluoroscopic image obtained in the same patient shows disomogeneous distribution of the iodized lipiodol-chemotherapy mixture, with presence of hypervascular region (arrow) at the periphery of treated lesion, demonstrating the viable portion of tumour.
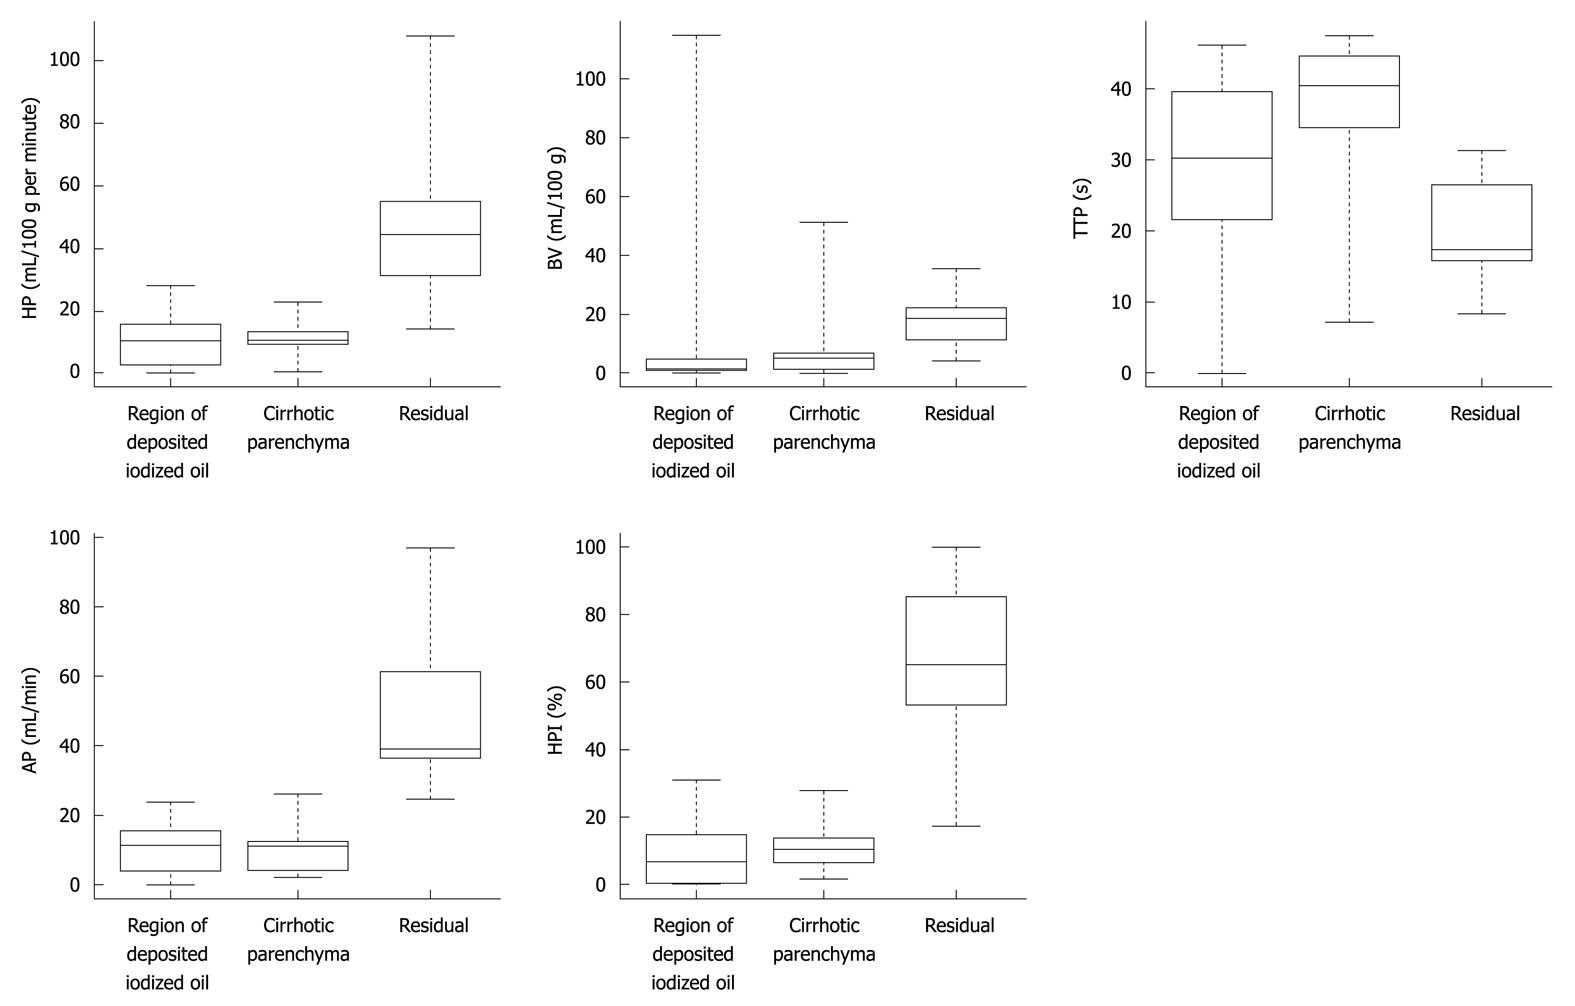
Figure 3 Box plots of the differences in perfusion parameters (hepatic perfusion, tissue blood volume, hepatic perfusion index, arterial perfusion, and time to peak).
The lower boundary of the boxes indicates the 25th percentile, line within the boxes marks the median, and the higher boundary of the boxes indicates the 75th percentile. Error bars below and above the boxes indicate minimum and maximum values. HP: Hepatic perfusion; BV: Blood volume; HPI: Hepatic perfusion index; AP: Arterial perfusion; TTP: Time to peak.
- Citation: Ippolito D, Bonaffini PA, Ratti L, Antolini L, Corso R, Fazio F, Sironi S. Hepatocellular carcinoma treated with transarterial chemoembolization: Dynamic perfusion-CT in the assessment of residual tumor. World J Gastroenterol 2010; 16(47): 5993-6000
- URL: https://www.wjgnet.com/1007-9327/full/v16/i47/5993.htm
- DOI: https://dx.doi.org/10.3748/wjg.v16.i47.5993


