Copyright
©2010 Baishideng Publishing Group Co.
World J Gastroenterol. Dec 21, 2010; 16(47): 5993-6000
Published online Dec 21, 2010. doi: 10.3748/wjg.v16.i47.5993
Published online Dec 21, 2010. doi: 10.3748/wjg.v16.i47.5993
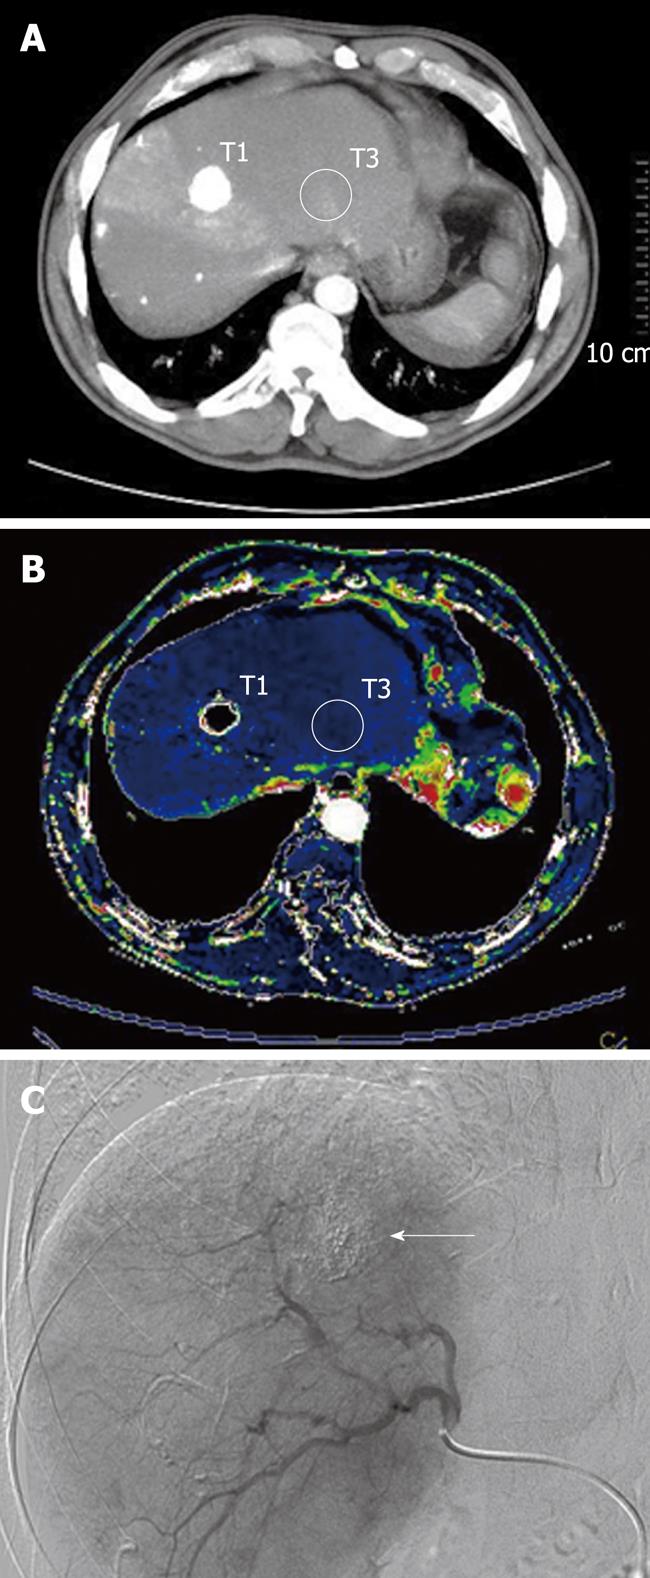
Figure 1 A 69-year-old man with Child A liver cirrhosis and 12 mm lesion of hepatocellular carcinoma, treated with transarterial chemoembolization, in the seventh segment of the liver that underwent computed tomography-perfusion study.
A: Multiphasic multidetector computed tomography scan image shows two hand drawn regions of interest (ROIs): T1 positioned on the successfully treated tumor contouring the treated area; T3 positioned on the surrounding liver parenchyma avoiding vessel structures, in order to obtain the quantitative perfusion data of the regions; B: Functional arterial perfusion colour map shows an homogenous distribution of perfusion area, with decreased perfusion range of colors compared with the background liver parenchyma; ROIs were positioned at the same level, on the successfully treated tumor (T1) and on the surrounding liver parenchyma (T3); C: Post chemoembolization digital fluoroscopic image obtained in the same patient shows excellent distribution of the lipiodol-chemotherapy mixture (arrow).
- Citation: Ippolito D, Bonaffini PA, Ratti L, Antolini L, Corso R, Fazio F, Sironi S. Hepatocellular carcinoma treated with transarterial chemoembolization: Dynamic perfusion-CT in the assessment of residual tumor. World J Gastroenterol 2010; 16(47): 5993-6000
- URL: https://www.wjgnet.com/1007-9327/full/v16/i47/5993.htm
- DOI: https://dx.doi.org/10.3748/wjg.v16.i47.5993


